I decoded the Bluetooth protocol of my Micro-Air EasyStart soft starters from the vendor’s Android app, with help from Claude Code, and now read their compressor data into Home Assistant through ESPHome.
I have Micro-Air EasyStart soft starters installed on both my HVAC compressors. I installed them in the summer of 2023, after I started getting frequent brownouts whenever a compressor started. The brownouts came from a combination of low supply voltage, later addressed by my electricity provider, and rising neighborhood demand. Older homes are being torn down and replaced with much larger ones, so panels are going from 80 A to 400 A. Every year more homes add AC and electric car chargers.
The EasyStart modules have built-in Bluetooth Low Energy (BLE), and the vendor’s phone app shows live current, line frequency, peak startup current, and a start counter. I monitor whole-home power usage and solar generation in Home Assistant. I wanted to use the BLE data for more granular AC power usage reporting, without installing additional current monitors in my panel. I reached out to Micro-Air, but they would not share the protocol. At the time I could not find anyone else who had decoded the protocol, and I lost interest.
In the meantime I had been watching Matt Brown’s YouTube channel on reverse engineering and Internet of Things (IoT) hacking. ESPHome had also made BLE device support much easier. With renewed motivation I set out to reverse engineer the BLE protocol myself, or rather, myself with a lot of automation and decoding help from Claude Code.
The app already has the protocol in it
A Bluetooth device’s protocol is rarely secret when you have the app that talks to it. An Android app ships as an Android Package (APK), a zip file of bytecode that decompiles cleanly.
The reverse engineering needed a laptop with Bluetooth and an Android phone. The phone needs developer options and USB debugging enabled so the Android Debug Bridge (adb) can reach it, plus nRF Connect and the EasyStart app. On the laptop, apktool and jadx do the decompiling.
The first phase pulls the app off the phone onto the laptop:
# a. pull the app off a phone with USB debugging enabled
adb shell pm list packages | grep -i easystart
adb shell pm path net.microair.easystart
adb pull /data/app/.../base.apk net.microair.easystart-4.2-19.apk

# b. unpack it two ways, because they are good at different things
apktool d net.microair.easystart-4.2-19.apk -o app-apktool  # smali, closer to the truth
jadx net.microair.easystart-4.2-19.apk -d app-jadx  # Java, easier to read

# c. then just grep
grep -rhoiE "[0-9a-f]{8}-[0-9a-f]{4}-[0-9a-f-]+" app-apktool/smali* | sort -u
grep -rEn "writeCharacteristic|onCharacteristicChanged|setValue" app-apktool/smali*
Three classes had everything. Connect does the connection and the service discovery. MainActivityKt$gattCallBack$1 is the Generic Attribute Profile (GATT) callback, which is where the response framing lives. Status polls on a timer and parses the frame, and it carries the fault-code table as a plain array of strings. I had the transport, the command, and the byte layout before I went anywhere near a compressor.
What the app said, including one thing that is a trap
The transport is a Laird BLE module exposing the Laird Virtual Serial Port (VSP) service, which tunnels a byte stream over GATT:
service d973f2e0-b19e-11e2-9e96-0800200c9a66
  d973f2e1-...  notify   module -> host, carries the responses
  d973f2e2-...  write    host -> module, carries the commands
e1 is notify and e2 is write, which is the reverse of the usual Laird convention. I had read enough about VSP to “know” which way around it went, and I was wrong. I confirmed the real roles by opening the GATT table once in nRF Connect on my phone and reading the properties off the two characteristics.
The module needs no pairing, and decoding it needed no Host Controller Interface (HCI) logging, packet capture, or Wireshark. Everything was in the code.
Commands are ASCII strings written to e2. They look like JSON and are not:
{"Cmd": ReadLive}
{"Cmd": ReadEEP}
{"Cmd": NormMode}
{"Cmd": ProgMode}
The value is unquoted and there is a space after the colon. Feeding that to a JSON encoder produces something the module ignores, so the bytes go out as a literal string. Only ReadLive matters for monitoring. The over-the-air (OTA) update and flash-buffer commands are in there too, but I did not explore them.
Eighteen bytes, and no checksum
Each ReadLive produces two notifications, which is the framing detail that cost me the most time later. One is an 18-byte binary frame. The other is an ASCII {"Sts": Success} acknowledgment. They arrive in that order and a host has to handle both.
The frame, little-endian and unsigned throughout:
10 00 00 05 3f 00 a9 20 f5 00 00 00 00 00 53 13 00 00
| Offset | Field | Formula | This frame |
|---|---|---|---|
[0] | header | constant 0x10 | 16 |
[1] | reserved | always zero | 0 |
[2] | system state | table below | 0, Normal |
[3] | learned starts | raw | 5 |
[4..5] | live current | u16 / 10 A | 6.3 A |
[6..7] | line frequency | 500000 / u16 Hz | 59.8 Hz |
[8..9] | last start peak | u16 / 10 A | 24.5 A |
[10..11] | short-cycle delay | raw u16 | 0 |
[12..13] | total faults | raw u16 | 0 |
[14..17] | total starts | u32 | 4947 |
Two of those are not guessable from staring at bytes.
Line frequency is a period, not a scaled reading. The field holds 8361, and 8361 is not 59.8 in any scaling. It is 500000 / 8361 = 59.80. I would have burned a long time trying to fit a multiplier to that if the app had not shown me the division.
Total starts is 32 bits, spanning four bytes where every other multi-byte field uses two. A 16-bit read looks completely fine until the counter passes 65535, which is decades away at my compressors’ rate. Then it silently wraps.
The state byte is a lookup into an array the app carries:
| Code | Meaning |
|---|---|
| 0 | Normal |
| 1 | Unexpctd Curr Flt |
| 2 | Short Cycle Delay |
| 3 | Pwr Intrrptn Fault |
| 4 | Stall Fault |
| 5 | Stuck SR Fault |
| 6 | Open Ovrld Fault |
| 7 | Overcurrent Fault |
| 8 | Bad Wiring Fault |
| 9 | Wrong Voltage Flt |
Code 2 is worth knowing. It is a transient waiting state after a stop, not a fault, and treating it as one gives you an alert every cycle.
There is no checksum and no cyclic redundancy check (CRC) in the frame. I went looking for one, because you expect one. The two unexplained bytes at [0] and [1] look exactly like where it would live. [0] is a constant 0x10 and [1] is always zero, in every frame I have captured. Neither is needed to decode anything.
The phone is the wrong tool for capture
Having the layout is not the same as having it right, so the decode needed a real capture. Two approaches failed first, and both fail in a way that looks like success.
nRF Connect on a phone only shows you the latest value of a characteristic. Both notifications land on the same characteristic, and the ASCII acknowledgment arrives second. The app faithfully displayed {"Sts": Success}, and the binary frame was simply never on screen. I spent a while believing the module answered a poll with a status string and nothing else.
Android’s HCI snoop log is useless on a stock phone. Turning on “Enable Bluetooth HCI snoop log” produces a log, and you feel like you are getting somewhere. On a stock Pixel it runs in FILTERED mode, so the btsnooz_hci.log inside a bugreport keeps only the first few bytes of each Attribute Protocol (ATT) payload. It confirmed the handles, and that the write payload started with 7b 22 43, which is {"C. It also gave me a frame-length estimate of about 20 bytes that turned out to be wrong. The real frame is 18. Unfiltered capture needs root.
What worked was the boring option: use the laptop as the Bluetooth central. A short bleak script, run with uv so there is no virtualenv to set up, connects and polls. It prints every notification raw, with a per-byte index alongside the decoded interpretation:
uv run easystart_monitor.py --discover
uv run easystart_monitor.py --name EasyStart_XXXX
EasyStart_XXXX stands in for the module’s own advertised name, which the --discover run prints.
Printing the raw bytes next to the decode is the part that matters. When a field is wrong you can see which byte moved.
One constraint shapes everything: only one BLE central can be connected at a time. The phone app has to be closed before the laptop can connect. You cannot watch the app and the capture side by side.
Ground truth is the vendor’s own screen
The decode is only worth anything if it agrees with the instrument that already works. So: connect the phone app, read the numbers off it, close it, connect the monitor, read its numbers.
| Field | App | Decode |
|---|---|---|
| Live current | 6.6 A | 6.3 A on the frame taken seconds later |
| Last start peak | 24.5 A | 24.5 A |
| Line frequency | 59.8 Hz | 59.8 Hz |
| Total starts | 4947 | 4947 |
| System state | Normal | 0, Normal |
Peak, frequency, and the counter match exactly, which is what pins the scaling and the endianness. Live current is a live value and moves between the two readings, so agreeing to a few tenths is the most that measurement can prove.
The radio is the sensor
Then came a behavior I did not design for and would not have predicted.
The module powers its Bluetooth radio only while the compressor is running. When the compressor stops, the module stops advertising and drops the connection. There is no idle state to poll.
That sounds like a limitation, but it is actually the single most useful thing I learned. The presence of the BLE connection is a reliable compressor-running signal, more reliable than any threshold I would have picked on the current reading. The running sensor in my integration is driven by the GATT connection state, not by comparing current against some number I made up.
It does have one consequence worth stating plainly: there is no such thing as a standby current reading here. Every sample is a running sample, so the /10 scaling is validated against running values only. I have no evidence about what the field would do at rest, because the field does not exist at rest.
When a compressor stops, running goes off and the live sensors publish not-a-number (NaN), so Home Assistant shows unknown rather than a stale number. The cumulative counters keep their last value, because there is nothing fresher to show and a counter reading zero would be a lie.
Then I found the same decode, twice
After it was all working, I went looking again, and found two people had been here before me. Keen-coffee did the original work, and DerekSeaman built on it.
My decode matches theirs on every field they decode. The swapped characteristics, the two-notification framing, the 500000 / period frequency, the 32-bit counter, all of it. Independently arriving at the same answer is about as good as verification gets for something with no specification.
I will not pretend that was the plan. Searching harder in 2023 would have saved me the whole exercise. What my version adds is byte [3], the learned-starts value, which neither of theirs decodes. It also builds the sensors through ESPHome’s Python code generation rather than through YAML lambdas.
Getting it into Home Assistant
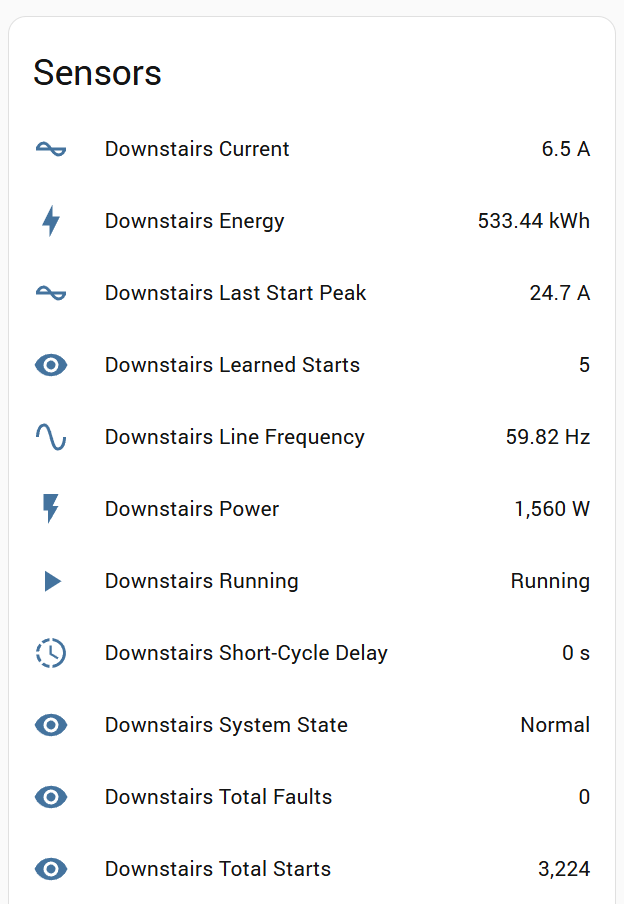
The integration is an ESPHome external component, a ble_client node that polls ReadLive on an interval and parses the frame. It publishes current, an estimated power, line frequency, last start peak, short-cycle delay, system state, the running flag, and the three counters.
The power figure is an estimate by design. The module reports single-leg current and no voltage at all, so power is current * line_voltage * power_factor with defaults of 240 V and 1.0. It is close enough for the energy dashboard, but it is not a meter. In Home Assistant, a Riemann sum integration helper turns that power into the energy sensor the dashboard reads. It pauses while the compressor is off, because the power sensor reports unknown rather than zero.
Four things cost me real time on the hardware side.
Range is much worse than you expect. These radios are weak. My existing Bluetooth proxy, in the office, would not hold a connection at all. The eventual answer was a dedicated ESP32 with an external antenna, physically sited at the units outside.
That diagnosis was guesswork until I added a signal-strength sensor, using ESPHome’s built-in ble_client received signal strength indicator (RSSI) type. It reads the RSSI of the live connection rather than of advertisements. That matters here, because a module stops advertising once something is connected to it. The office proxy measured -93 dBm on a live link, which is essentially the sensitivity floor. Around -60 dBm is healthy. That one number turned “everything is intermittently unavailable” into “the radio is too far away”, which is a fixable problem.
Connection slots are finite and the accounting is not obvious. An active bluetooth_proxy reserves three, so a proxy hosting two modules needs esp32_ble: max_connections: 5. The RSSI sensor attaches to an existing client and costs nothing extra.
Changing that number needs a clean rebuild. max_connections maps to a compile-time sdkconfig value. An incremental build regenerates the C++ and keeps the cached config, so the change appears to apply and does nothing at runtime. esphome clean first, then verify the value in the generated sdkconfig rather than trusting the build.
esphome upload does not compile. After a failed build it will cheerfully flash the previous binary. That is a genuinely confusing way to spend twenty minutes wondering why your change did not take effect.
The part that rebooted my ESP32
With the component deployed, the device started rebooting at random. Other times it would connect, report itself subscribed, and never receive a notification. Both turned out to be the same race in ESPHome’s ble_client. It released the peer’s discovered services, which frees Bluedroid’s GATT database, while a notification registration was still in flight. Whether the chip asserted or silently lost its subscription came down to timing. A single ble_client.disconnect action anywhere in a configuration happens to suppress that release, which is why the bug had stayed hidden.
I filed it with an 80-minute serial capture and a reduced reproduction as esphome/esphome#17921. The fixes shipped in ESPHome 2026.8.0 (#17919) and 2026.9.0 (#17920). My own component also avoids it by reporting ESTABLISHED only after its registration succeeds, which was always the correct order.
Physical installation
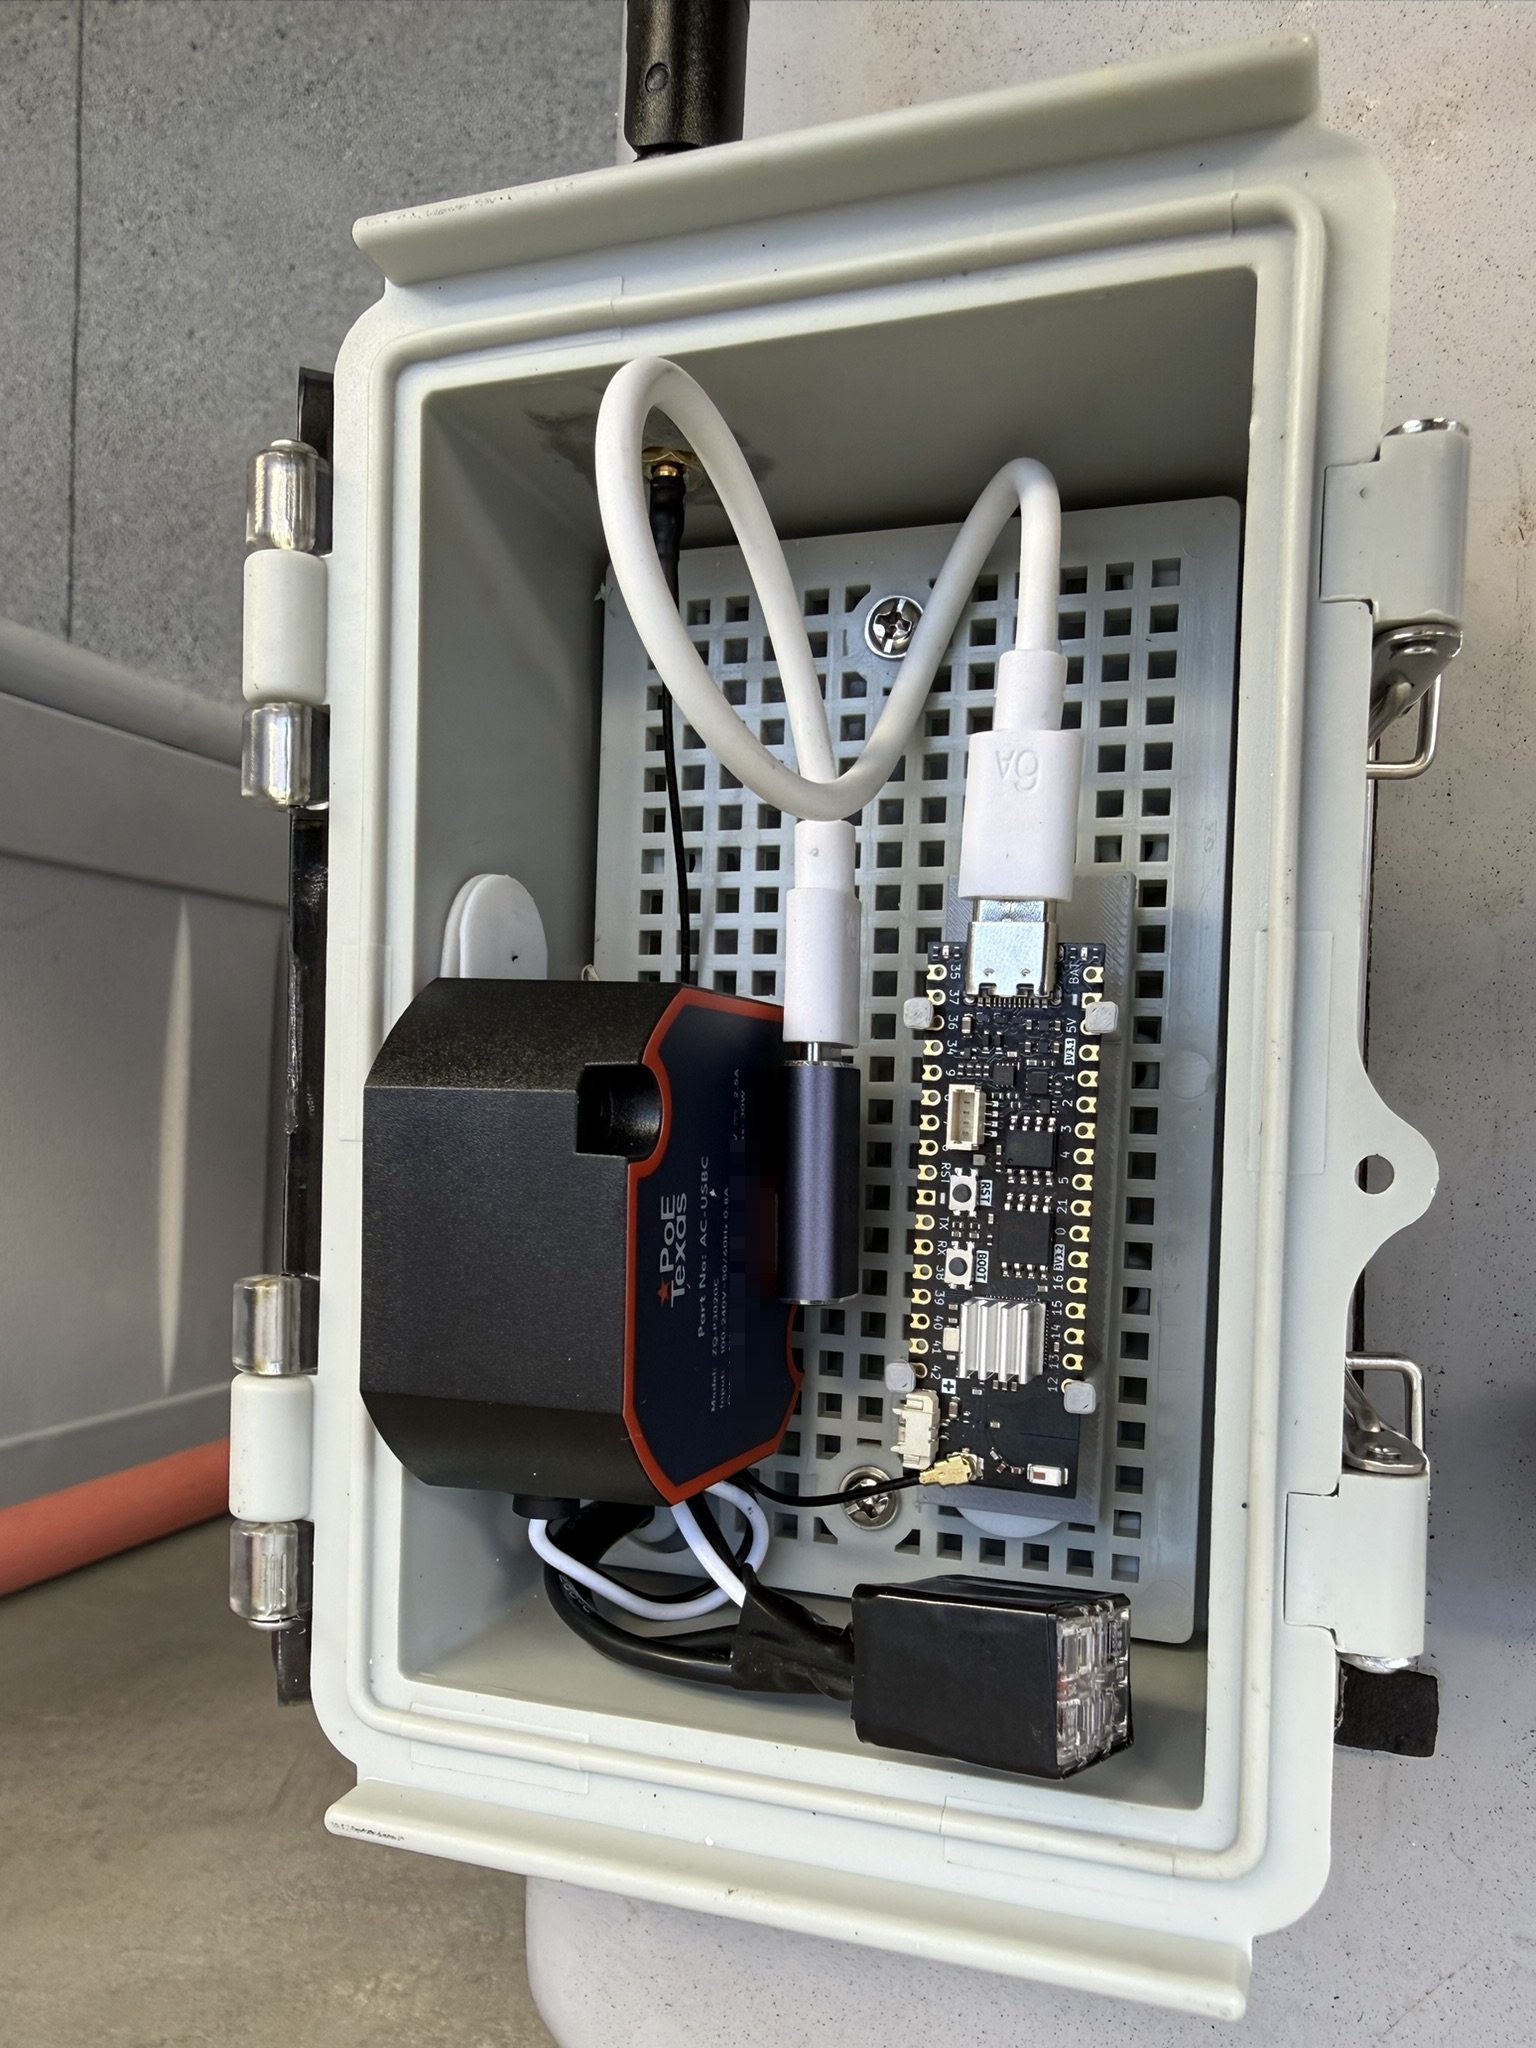
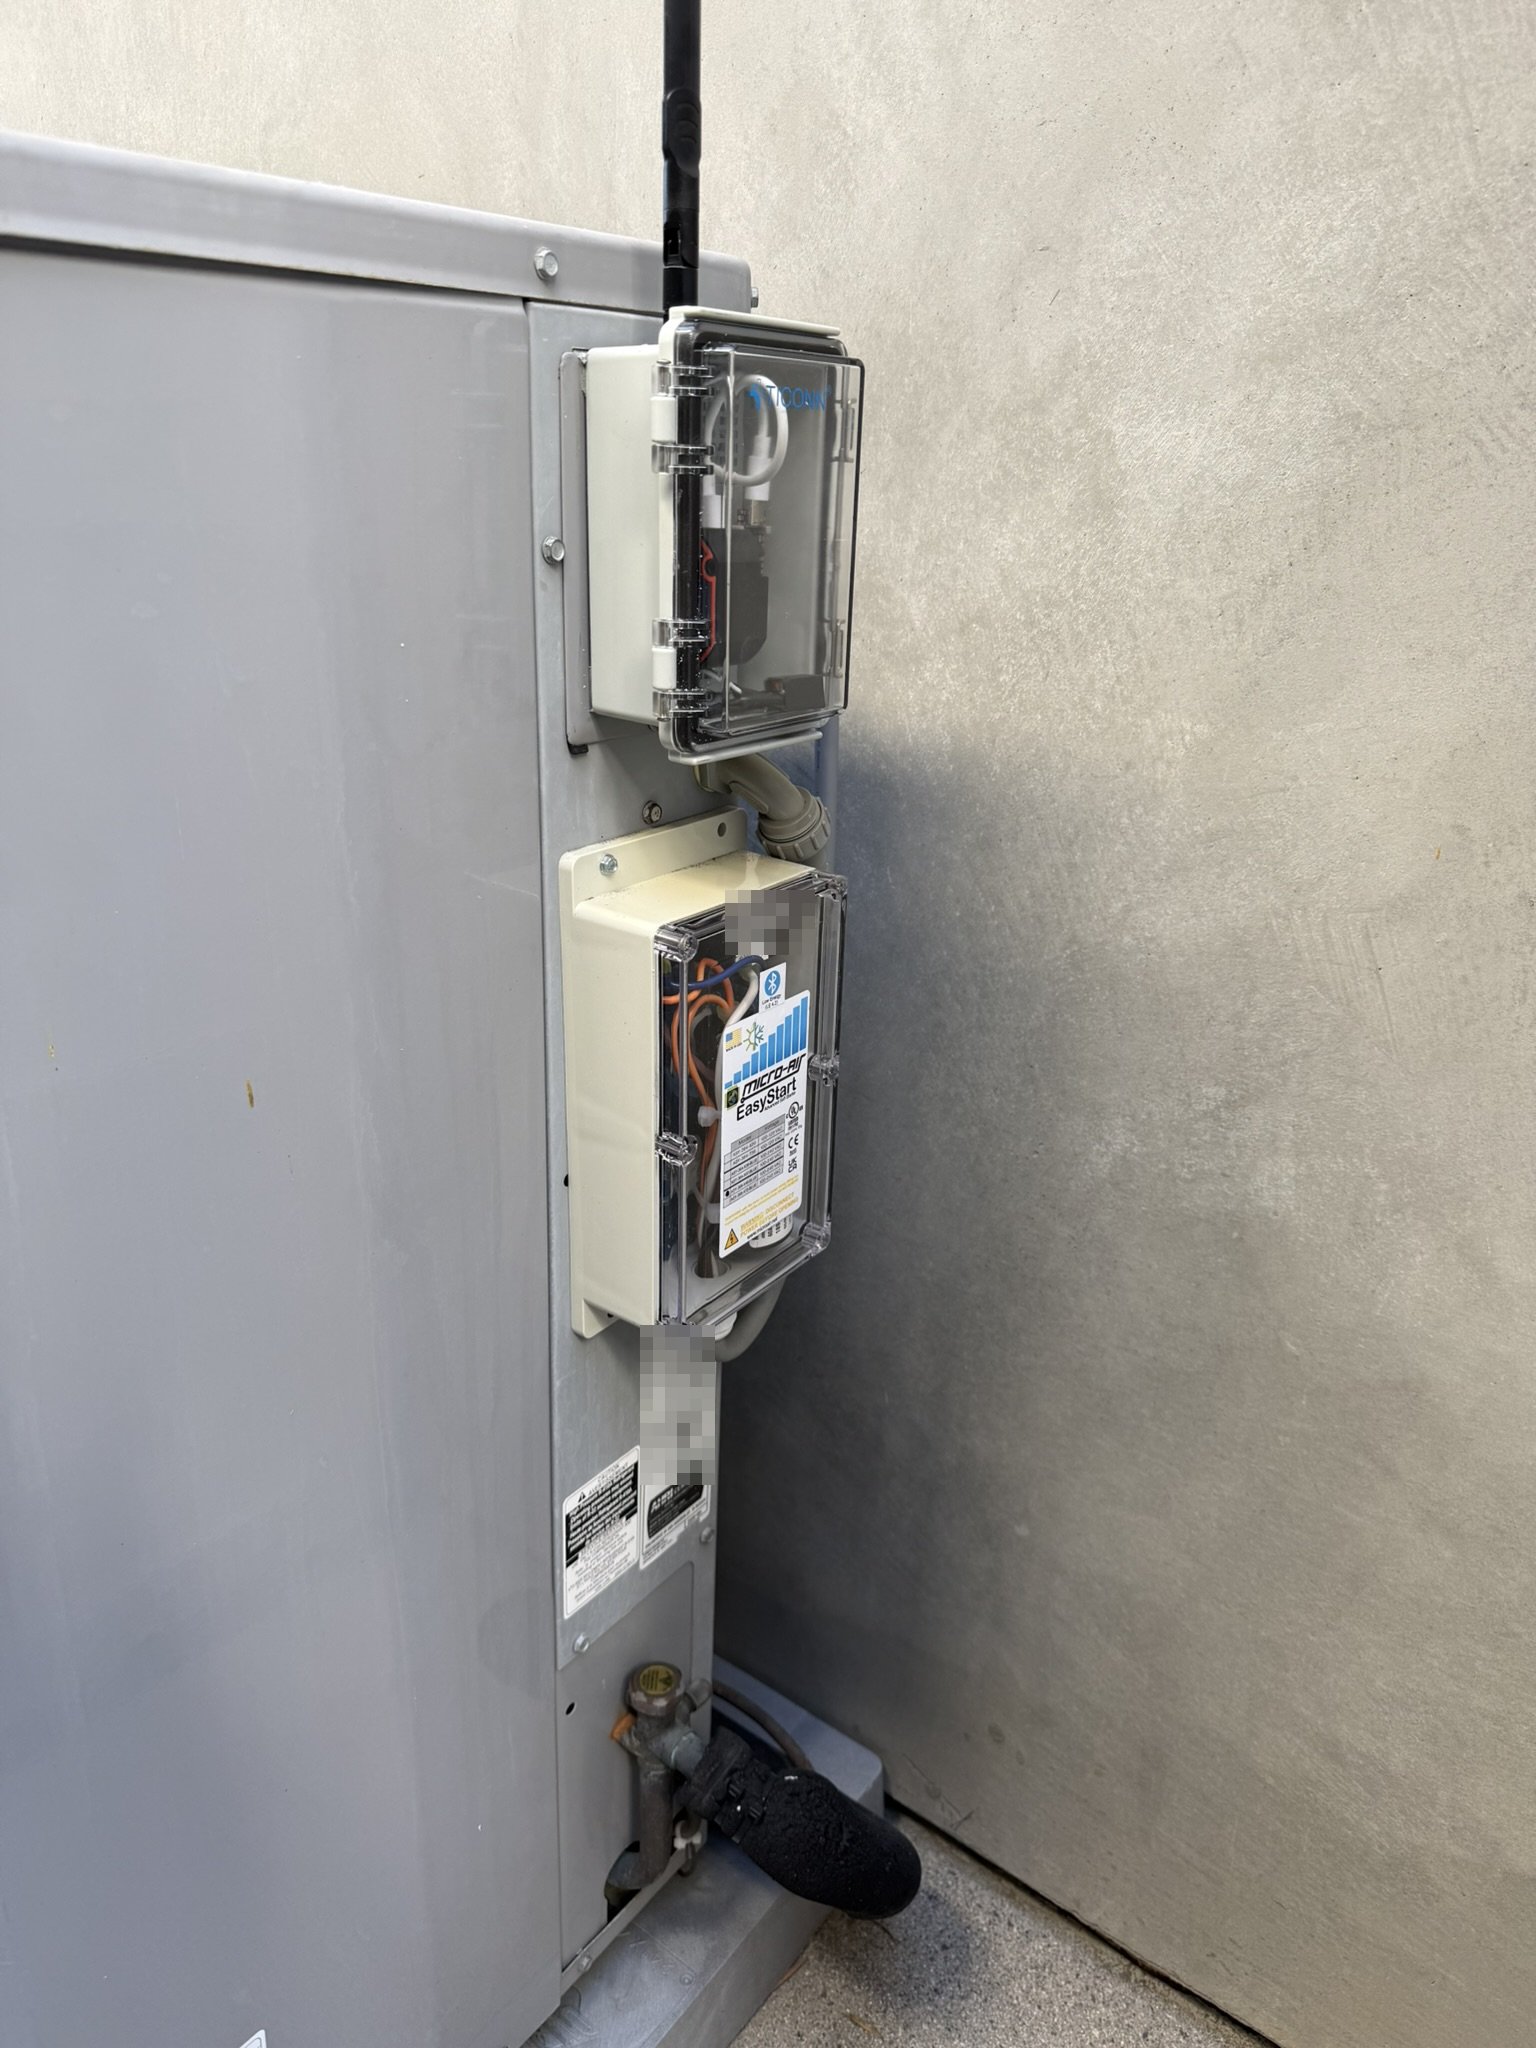
I used an Unexpected Maker ProS3D, an ESP32-S3 board running ESPHome as the BLE proxy, connected over Wi-Fi. I like the ProS3D because its internal or external antenna is selectable in software. It sits in a TICON Outdoor Enclosure on one of the compressors. That is close enough to the other compressor to get a good BLE signal from both. A PoE Texas in-wall USB-C PSU rated for 240 VAC powers it from the compressor’s 240 VAC supply line.
When I bought my EasyStarts, the installation instructions allowed an outdoor install without any additional protection. They now recommend an enclosure, and I can see why. The wiring inside the EasyStart’s clear enclosure is already fading. That means sunlight is getting through the clear lid, and UV damage to the wire insulation and the electronics will follow. I applied BDF NSN70 heat-rejecting window film over both clear lids to help protect the components from heat and UV damage.
I did almost none of this by hand
I ran this through Claude Code, as I did the blog migration. The shape of it is worth describing, because it is not what I expected.
I did not hand it the problem and wait. I did a step manually, then asked it to automate that step, then did the next step manually, then automated that. Pull the APK, automate it. Decompile and grep, automate it. Decode a field, generalize the decoder. Each round I also asked it to write up the step just finished, and to refine the write-up with whatever had gone wrong. That is how the gotchas in this post came to be written down at all rather than forgotten.
At the end I deleted every artifact I had made by hand and gave it one prompt:
I have the Micro-Air EasyStart app installed on my Android phone, developer options and USB debugging are on, and it’s plugged into this computer. Extract the APK, decompile it, and reverse-engineer its Bluetooth protocol. Then write me a
uv-runnablebleakmonitor to validate the decode against the live module. And finally write an ESPHomeble_clientcomponent to expose it to Home Assistant.
It drove the whole thing: adb, apktool, jadx, the grepping, the byte layout, the monitor, the component. My entire contribution was plugging in the phone, tapping one USB debugging prompt, standing near a compressor, running a couple of commands, and pasting text back.
That is the part I would emphasize to anyone thinking about this kind of project. The barrier to reverse engineering a device was never the difficulty. It was the tedium, and the tedium is the part that is now cheap. The judgment still has to come from somewhere. I decided to confirm the swapped characteristics against real hardware rather than trust the convention. I decided an 80-minute capture was the evidence the upstream issue needed, and decided not to touch the OTA commands. But the ratio of what I decided to what I would have had to type is not close.
The playbook
Doing each step by hand and then automating it produced more than a working component. It produced a written playbook for reverse engineering a BLE device with an agent doing the driving. The playbook sets out what the human does and what the agent does, then works in phases: static analysis of the APK, live validation from the laptop, and passive sniffing only when a write or OTA command has to be decoded. It ends with a generic version of the prompt above, which is enough to start the whole run against a different device.
The playbook lives on GitHub next to the protocol documentation, the ESPHome component, and the monitor.