Earlier this year we moved a couple miles from Redondo Beach to Manhattan Beach, bigger house, better school district.
As far as the house and area is concerned, it is definitely an upgrade, but not so for the utilities.
Monthly utilities are a lot more expensive, not so much the per unit fees, but the base service fees, not just a couple $, but three of four times what we paid in Redondo Beach. Now, if it came with better offerings, or better service, or higher quality, ok, but the opposite.
Water quality is worse, specifically hardness, MB supplies its own water, RB gets water from LADWP, and that unsightly water tower that no longer serves any practical purpose, with efforts to demolish it always being thwarted.
As a new resident trash collection makes me pay almost thirty $ extra per month for an extra trash can, while grandfathered-in residents keep extras for free. Now, I know it is unfair to judge a service by their employee’s actions, or is it, but the trash collection guy is a jerk, if a little dust and having to get out of the truck is going to get you agitated, you are in the wrong business, especially when compared with the pack of trash collection men in RB that were always friendly and willing to give a hand.
But, I really digress, I want to discuss electrical power quality problems.
In the six plus years we lived in RB, I think we had one scheduled power outage, and maybe two short unplanned outages. Since moving to MB earlier this year, we’ve had two scheduled outages, one lasting an entire day, and several unscheduled outages.
The power is unreliable, SCE knows it, the city knows it, there are some plans addressing it, see here here here here.
My concern is not really power being on or off, it is power being on but of poor quality; an electronic equipment killer.
When we moved in, the first signs of electrical problems were flickering lights. At first I thought it was a problem with the Vantage light control system, but even lights directly on utility power flickered. As soon as I hooked up UPS’s to my servers and the signal distribution system, the UPS’s started complaining about power quality. Occasionally during the day I would get a notification from the UPS’s that it detected a distorted input, and every night the UPS’s would complain about low input voltage.
It may be coincidental, but I’ve also had two astronomical clock light timers fail at the same time, the casings were scorched in what appears to be signs of electrical damage.
UPS Event Log:
In order to quantify the problem, I used a Fluke VR1710 Voltage Quality Recorder. The device plugs into a mains outlet, and records events, and a USB port is used to configure the device, and download recorded data.
As I am not a power quality expert, I referred to Wikipedia to and Power Quality In Electrical Systems for information and reference material. To further simplify the analysis, I opted to compare my office power with my home power, this allowed me to easily visualize the quality differences, granted, I am assuming my office power is good.
I configured the VR1710 to take measurements every 10s, and to record exceptional events, about 10 days worth of data. I set the dip threshold to 106V, the swell threshold to 127V, and the transient sensitivity to 5V.
VR1710 Settings:

Below are reports detailing the recorded events, click graphs to view full resolution:
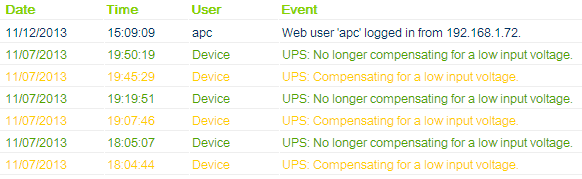
Home Voltage:
There is a clear pattern of voltage drops below 102V every evening, these drops are also observed in the UPS logs showing low voltage warnings around 7:30PM every evening.
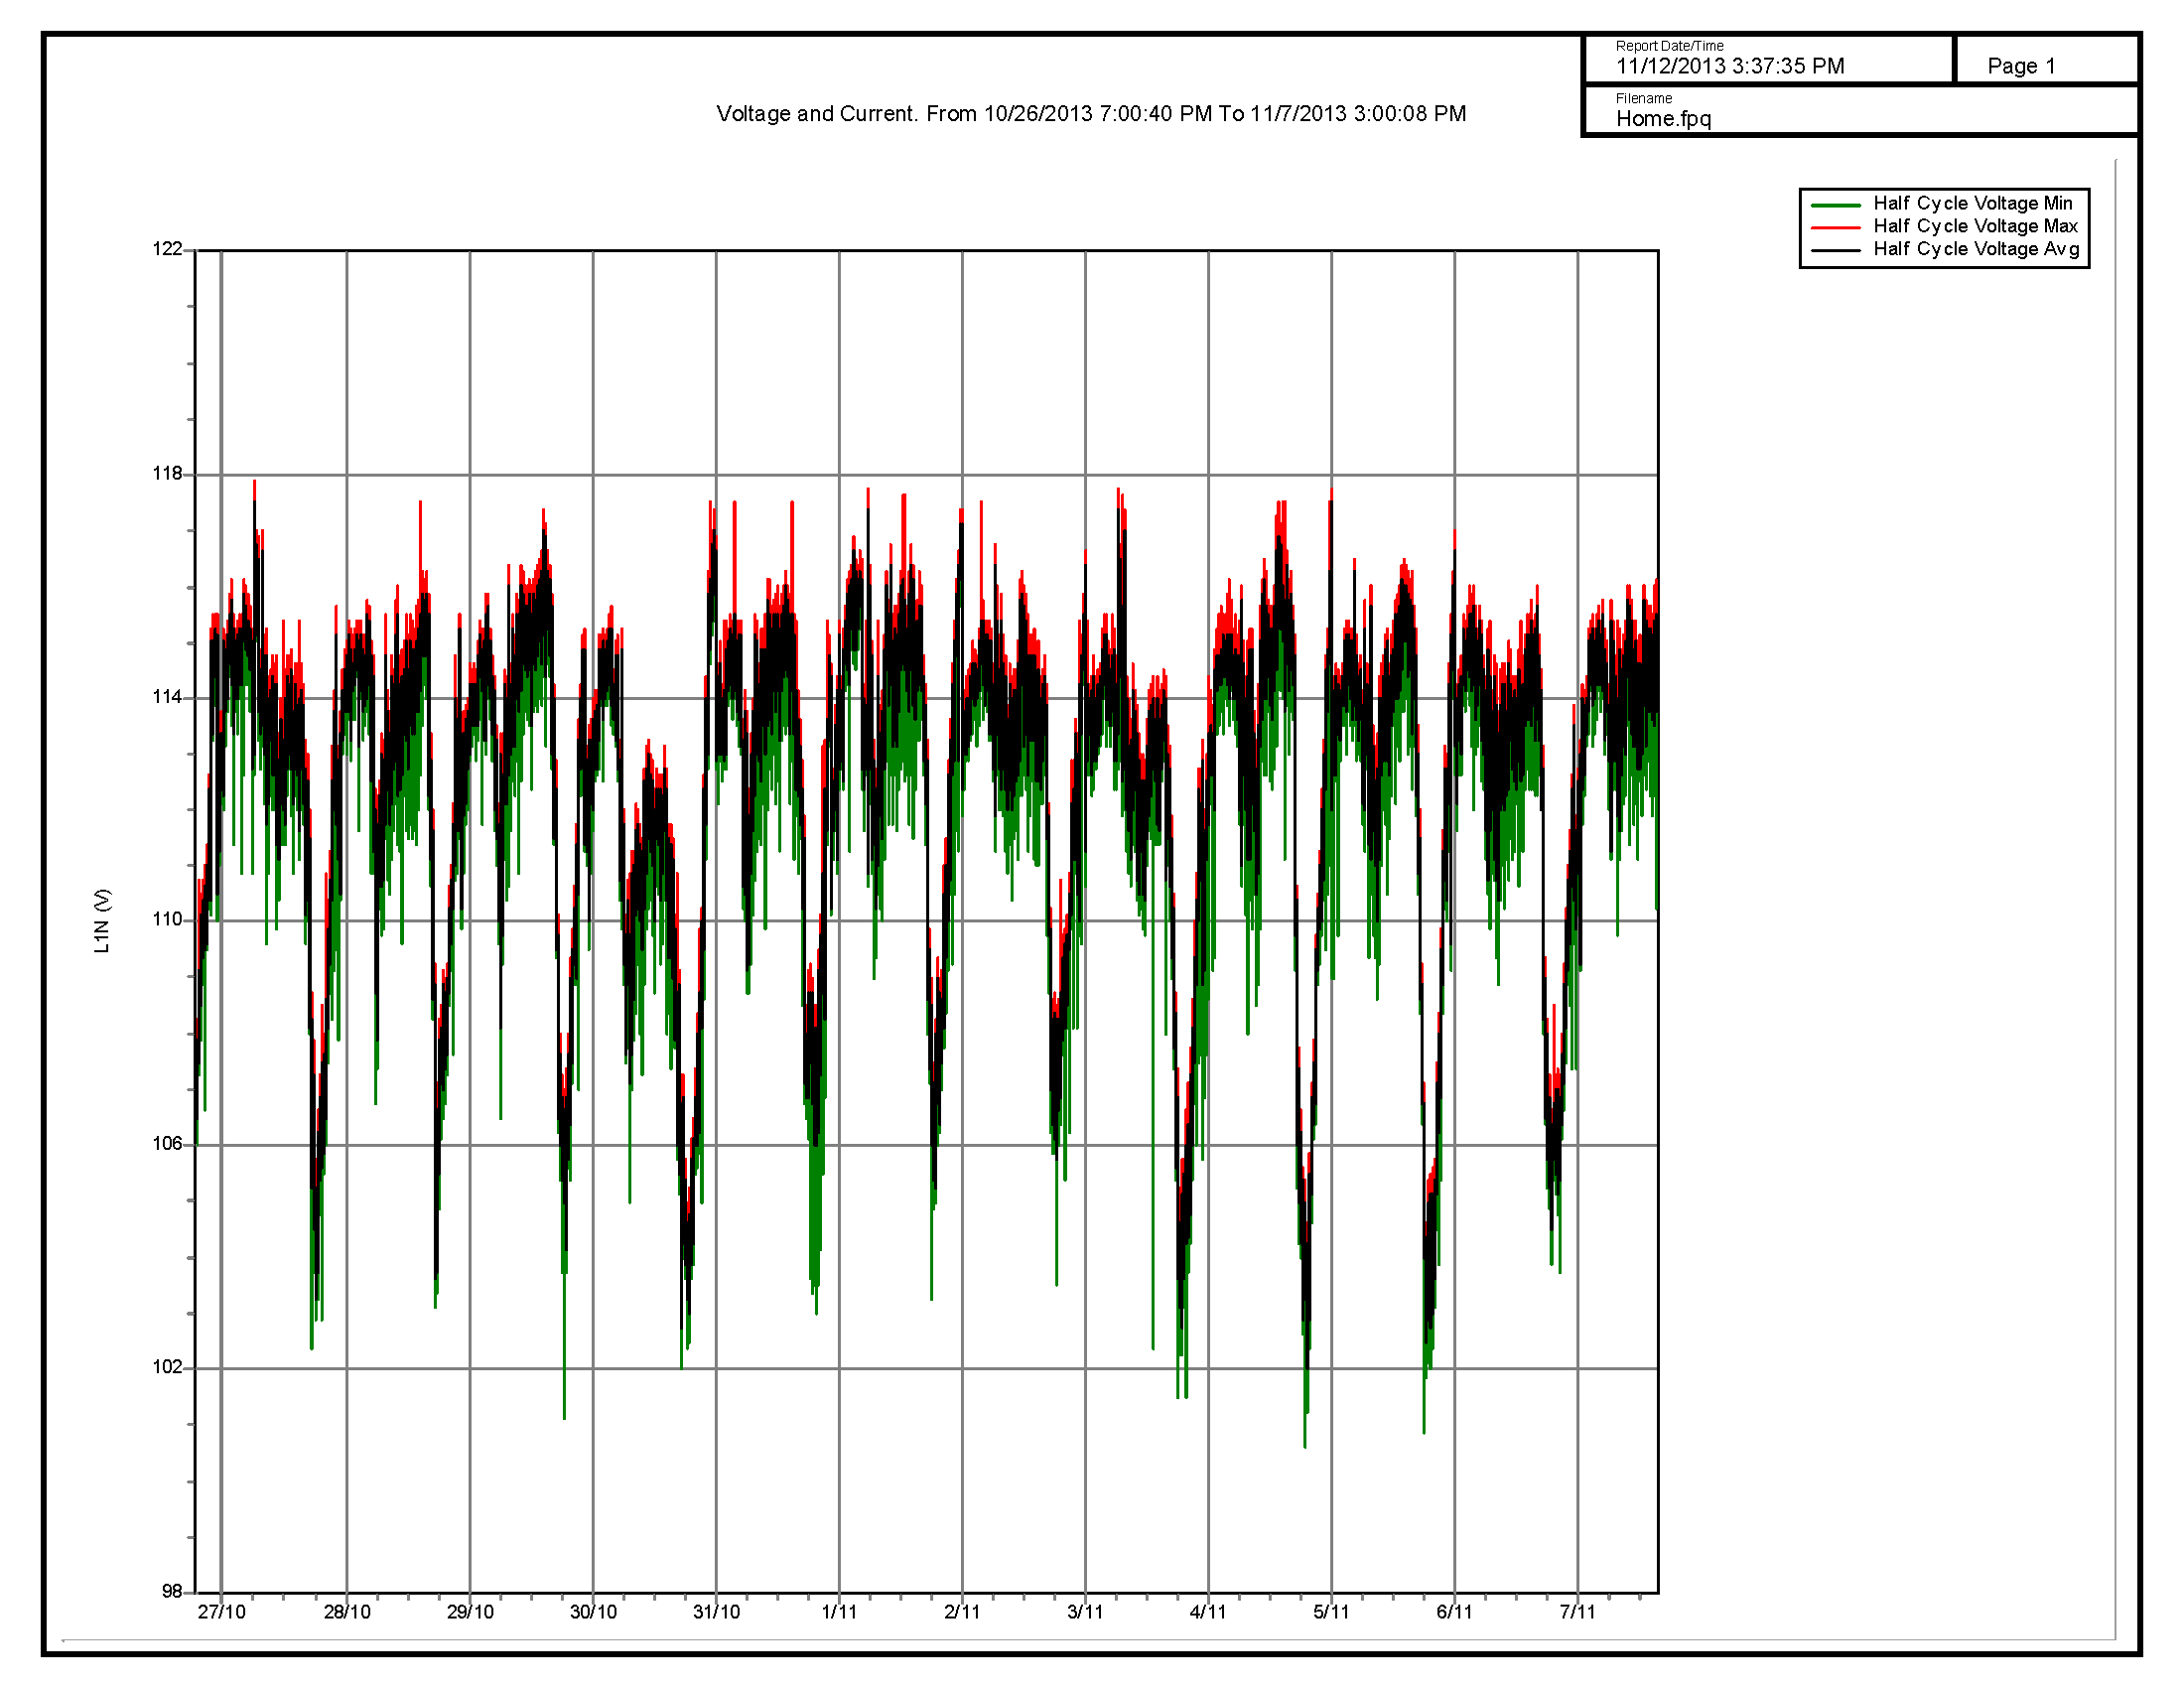
Office Voltage:
The office voltage is very stable.
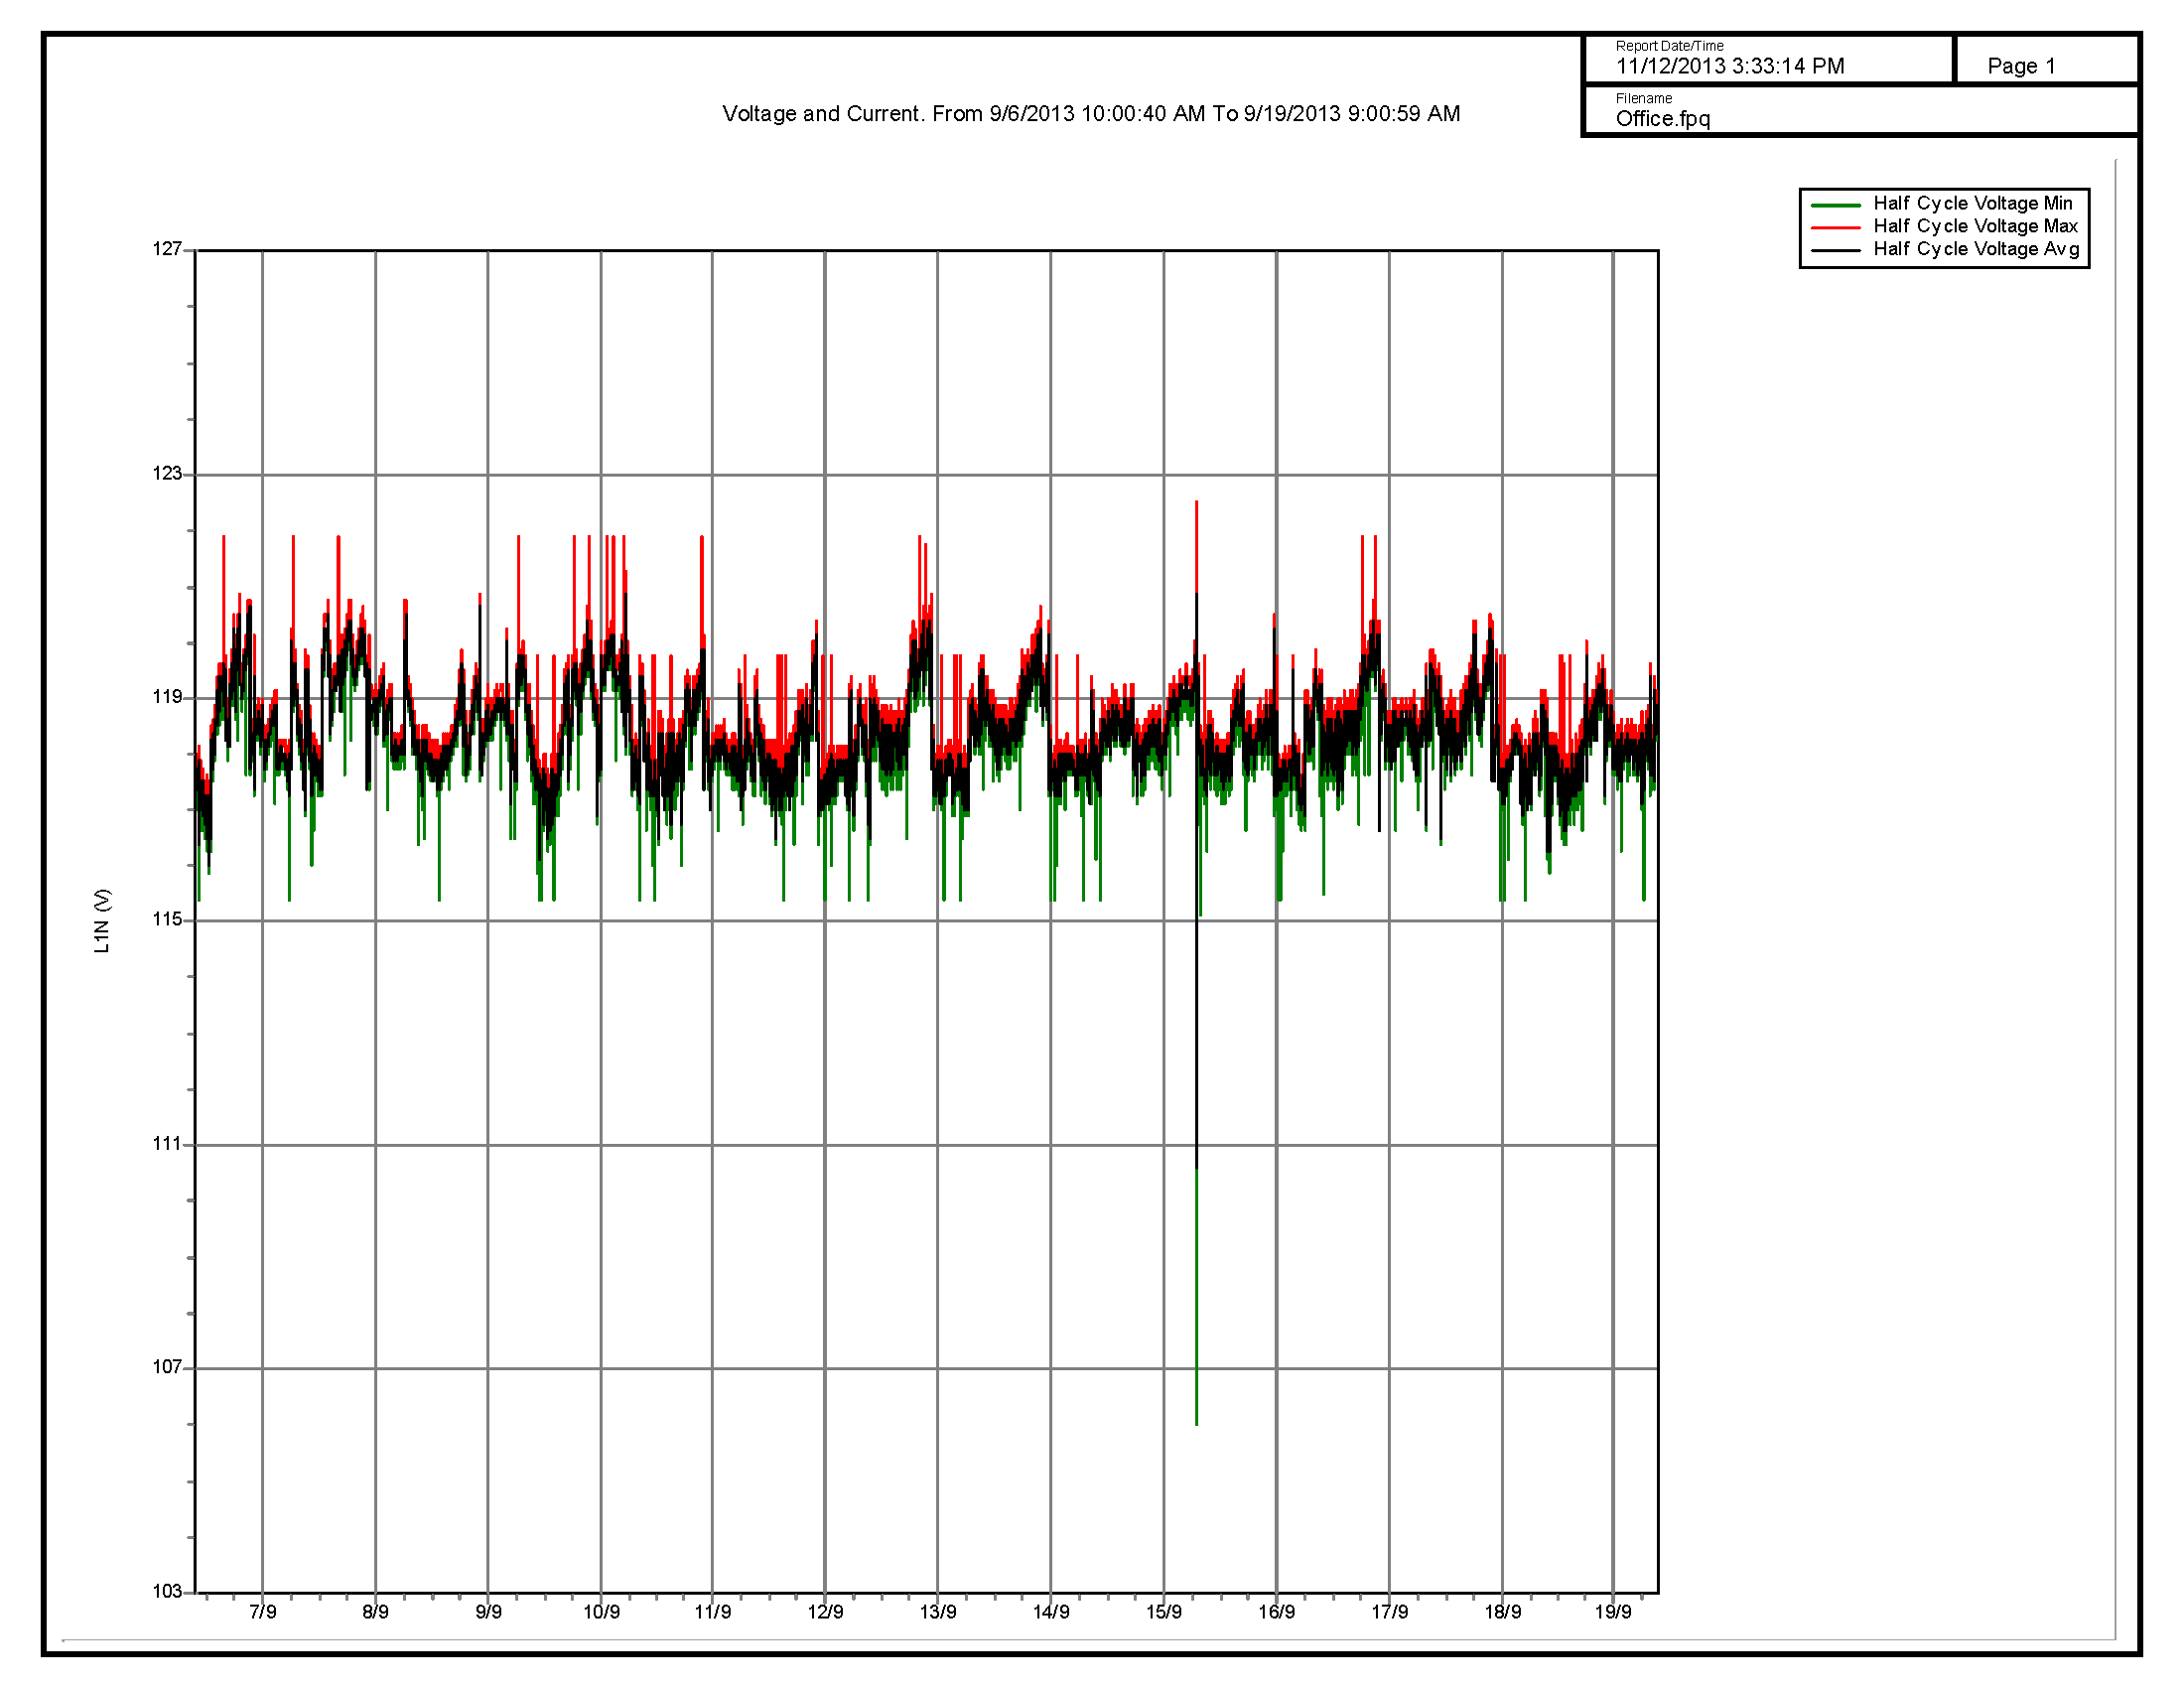
Home Flicker:
According to Wikipedia and PQW short term flicker (Pst) is noticeable at values exceeding 1.0, and long term flicker (Plt) is noticeable at values exceeding 0.65. These results would explain why we observe lights flickering.
Office Flicker:

Office flicker values are well within acceptable ranges.
Home Statistics:

From this distribution we can see the wide spread in voltages, well below the 120V theoretical norm. This chart does not show it, but the 95% distribution is 115.5V, and the 5% distribution is 106.1V.
Office Statistics:

The office voltage distribution is nicely clustered around 119V, with the 95% distribution at 119.6V, and the 5% distribution at 117.4V.
Home Dips And Swells:
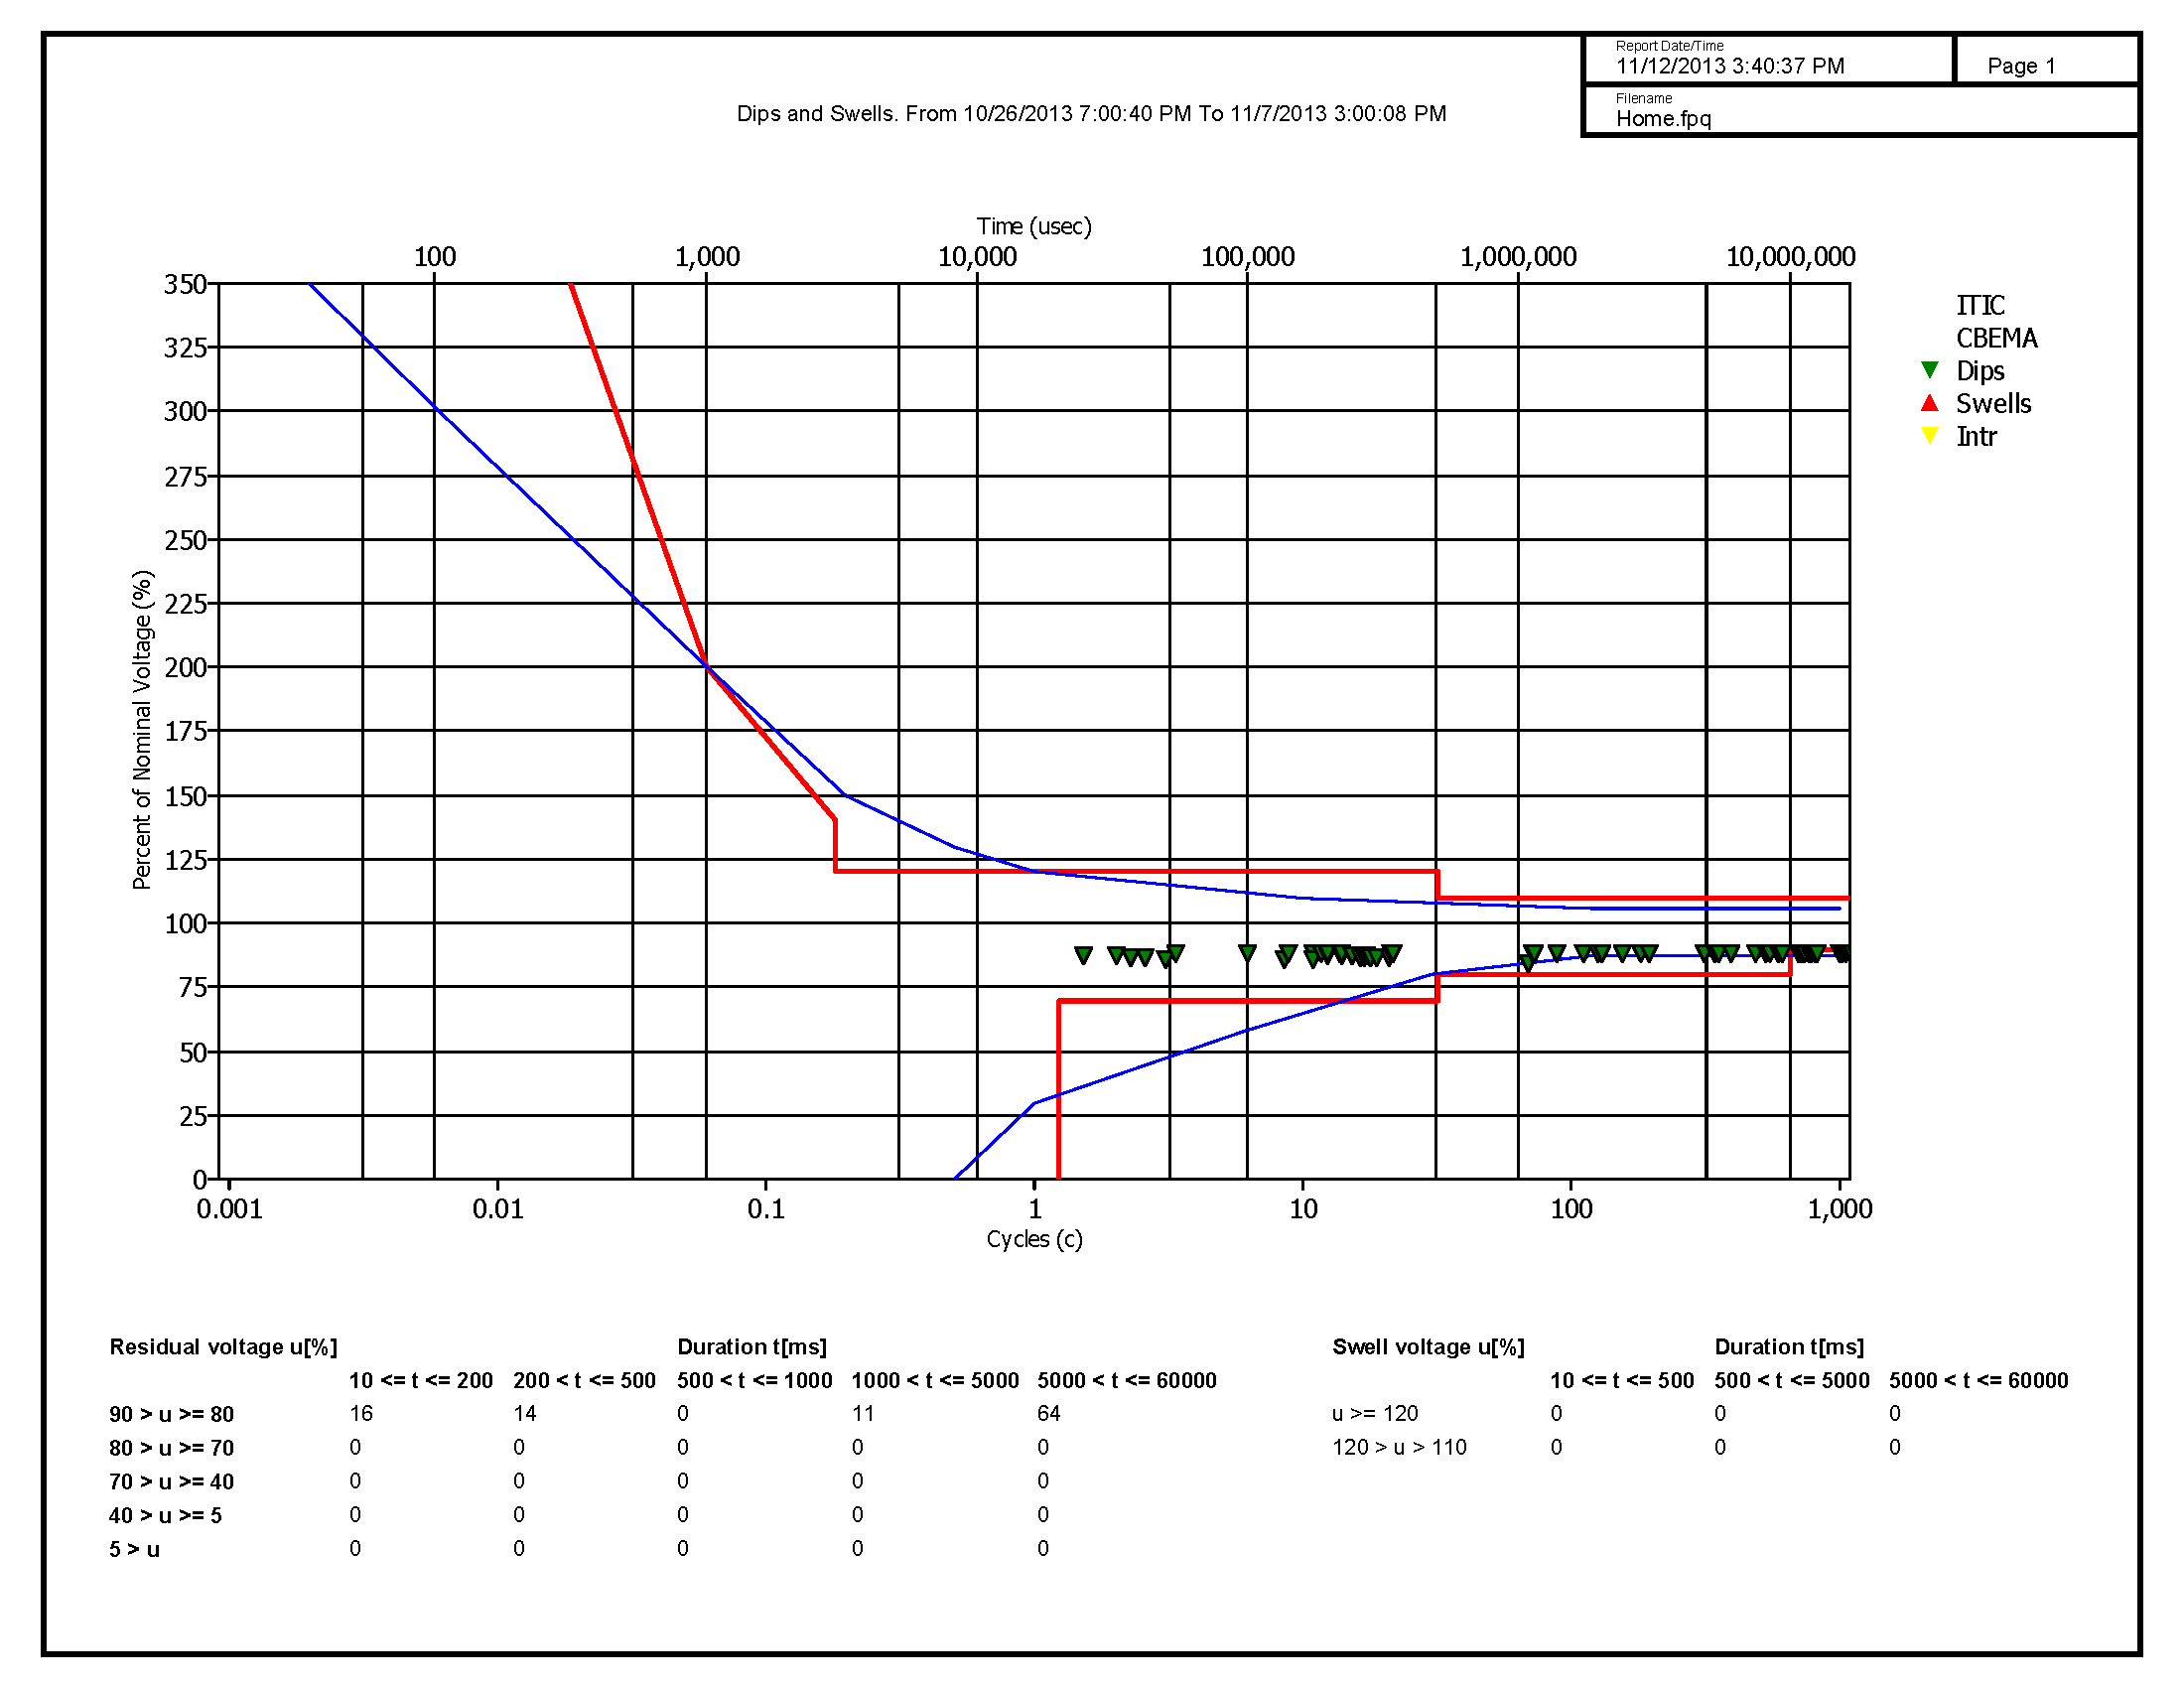
ITIC and CBEMA are standards for acceptable power quality, see here for a detailed description.
To describe the graph, I quote from the Fluke Power Log software manual:
Dips and swells are shown on a CBEMA (Computer Business Equipment Manufacturers Association) and ITIC (Information Technology Industry Council) plot classification table according to EN50160. On the CBEMA (blue) and ITIC (red), curve markers are plotted for each dip and swell. The height on the vertical axis shows the severity of the dip or swell relative to the nominal voltage. The horizontal position shows the duration of the dip or swell. These curves show an ac input voltage envelope which typically can be tolerated (no interruption in function) by most Information Technology Equipment (ITE).
Based on the graph we can see a large number of events exceeding the acceptable ranges. Since there were no dips at the office, there is no graph for the office.
Home Transients:
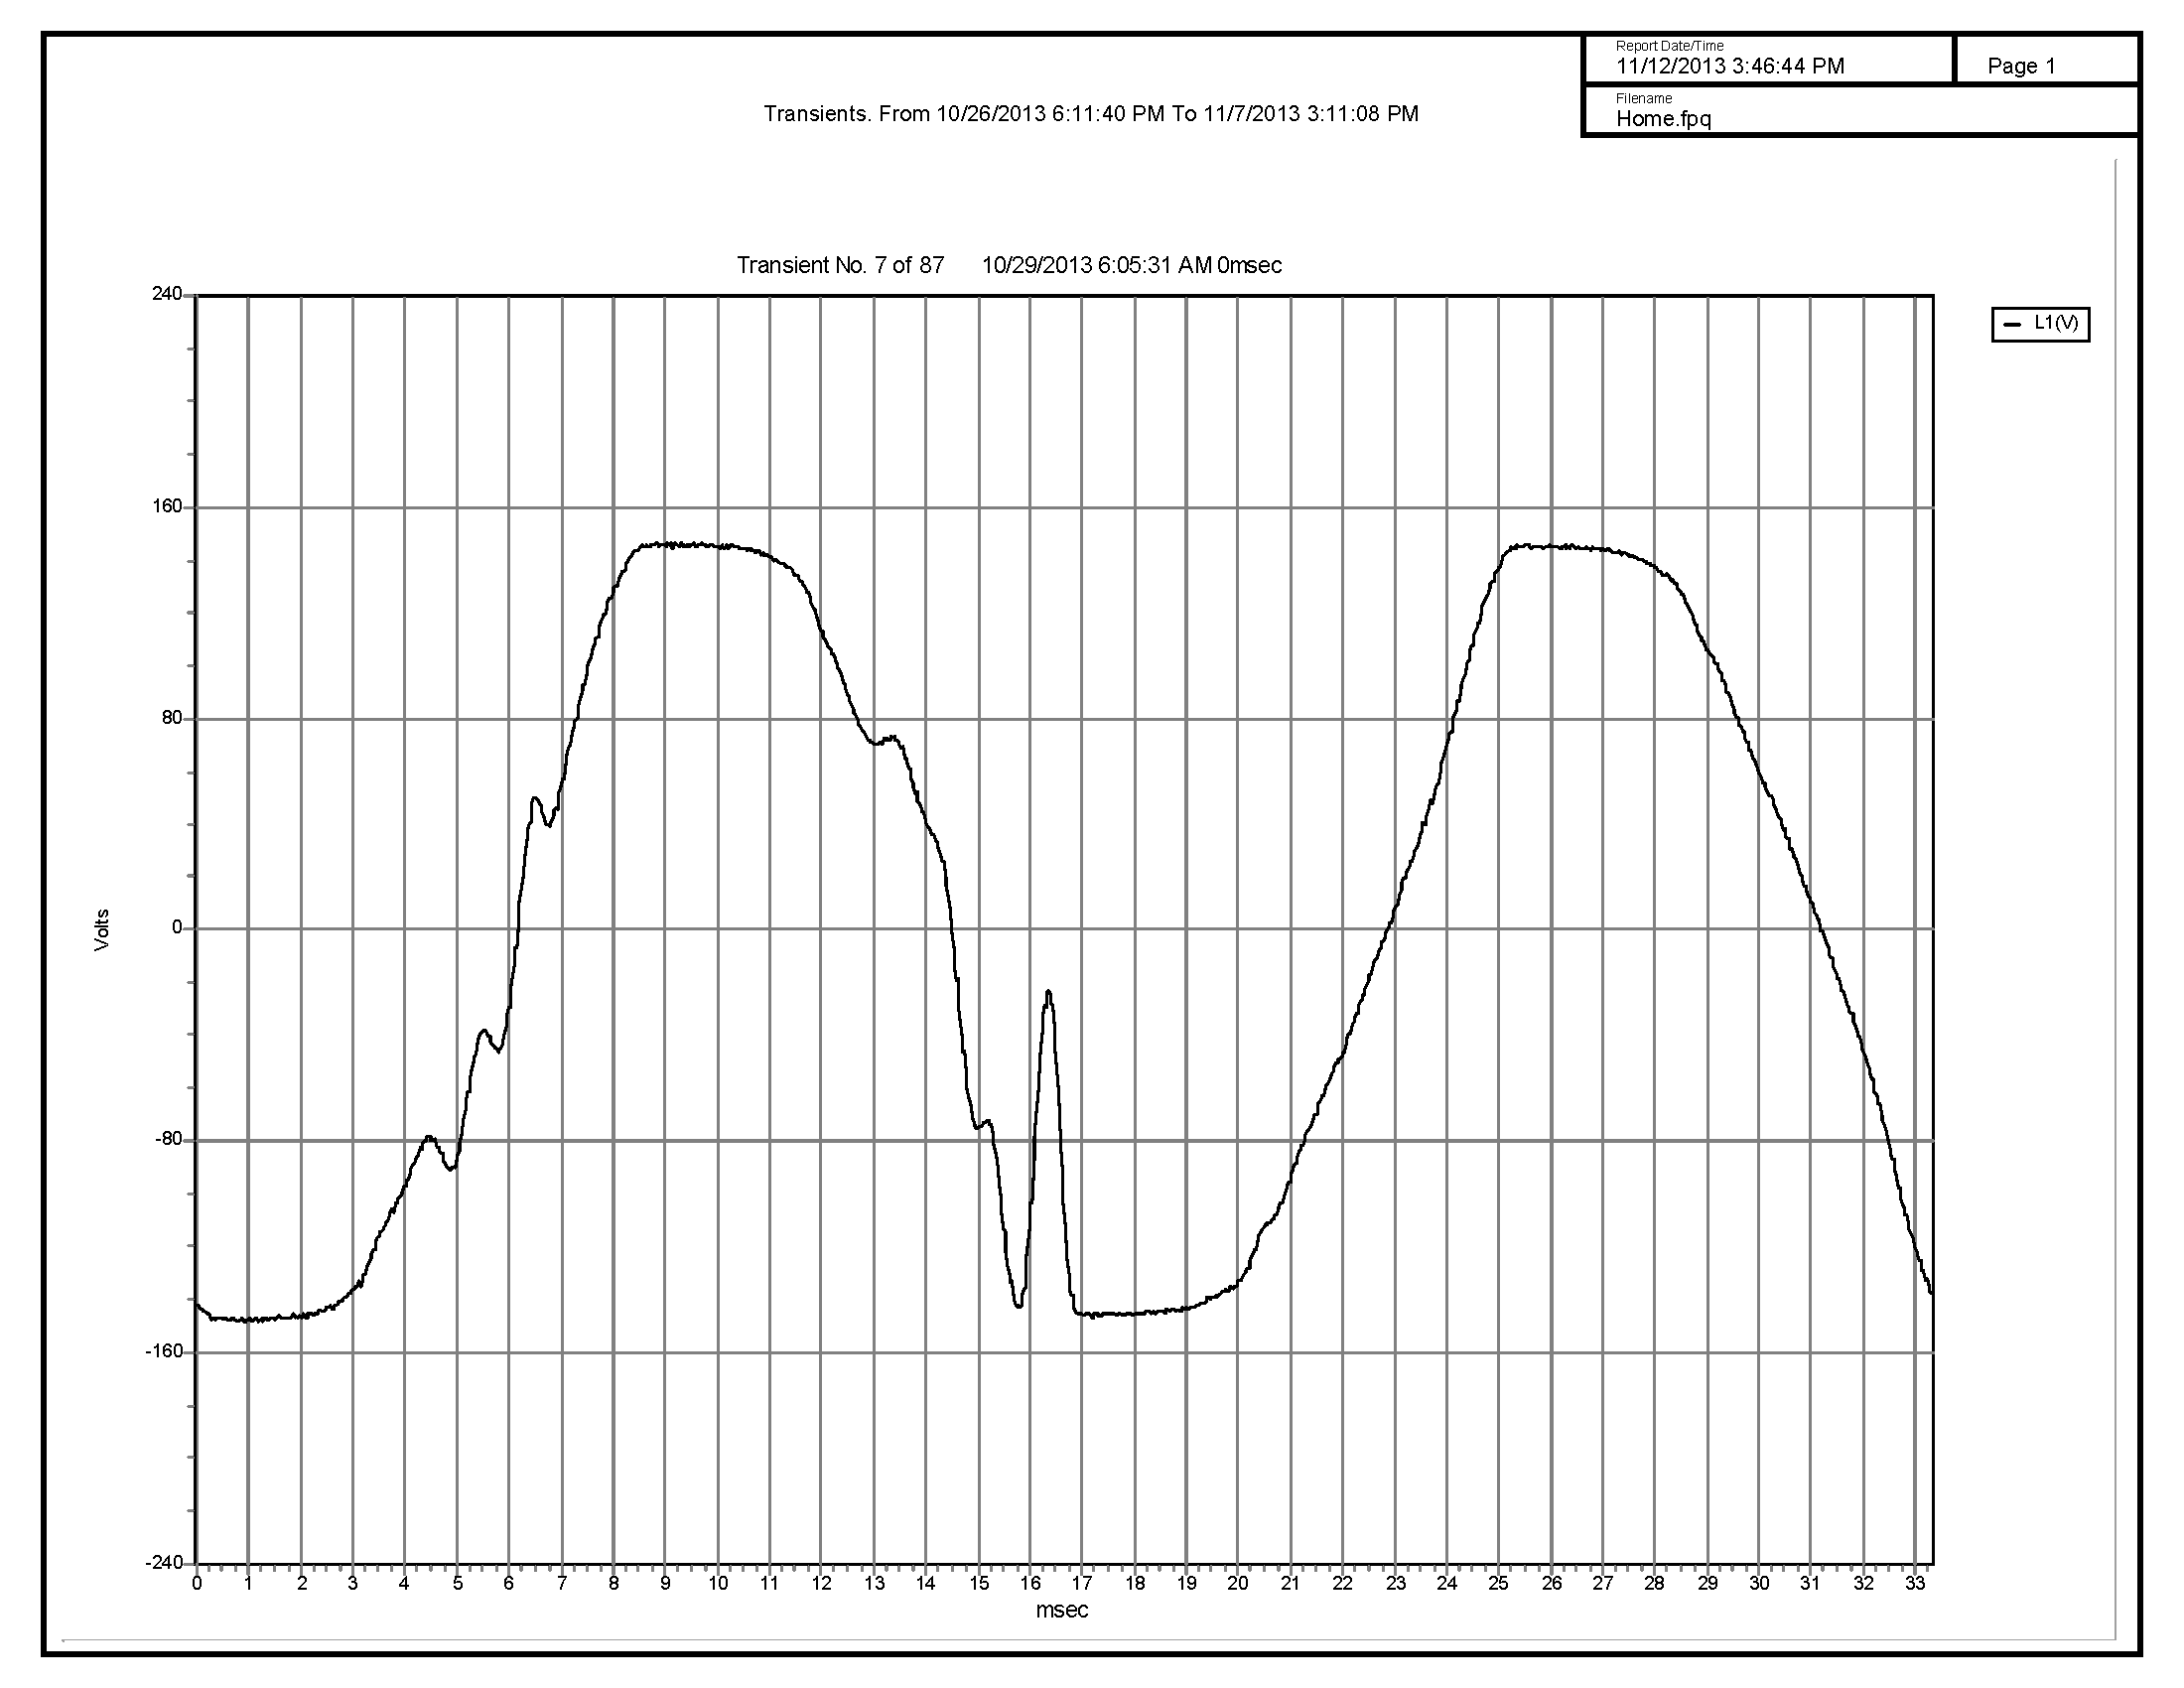
I only show the transients graph for home, as the wave forms all look different, and the only difference between home and office is 87 events were recorded at home while 10 events were recorded at the office for the same approximate time duration. See PQW for an explanation of transients.
We can clearly see that the power quality at my house is significantly worse compared to the power at my office.
I am speculating, but I wonder if the old transformer across the road can supply sufficient power, given that it used to supply power to three small very old houses on four lots, demolished to make room for four new larger houses?
I just opened a support ticket with SCE, let’s hope they can do something about the problem.

Pieter, this is very interesting and very well-researched. I’m curious what the median AC value should be. I know that for batteries, the listed DC voltage is a minimum requirement.
Also, if you don’t have any success with the ticket you put in, let me know. Accidents have been known to happen to power transformers. It’s a well known fact that chupacabra often chew on them to gather their sweet, delicious electrolytes.
LikeLike
Pieter, very well done. Were you able to borrow that meter? Pretty expensive. If the transformer was designed for older houses, it’s a safe bet that the occupants used less power per household than people do nowadays. It seems a very good bet that the transformer is undersized. Or something is undersized that is serving you.
Ken, wouldn’t average voltage be more important than median in this case? From Pieter’s graph, I think average is fine but variance is the problem.
LikeLike