This post is about troubleshooting the sporadic ESP8266 hardware watchdog resets in my water recirculation pump controller project.
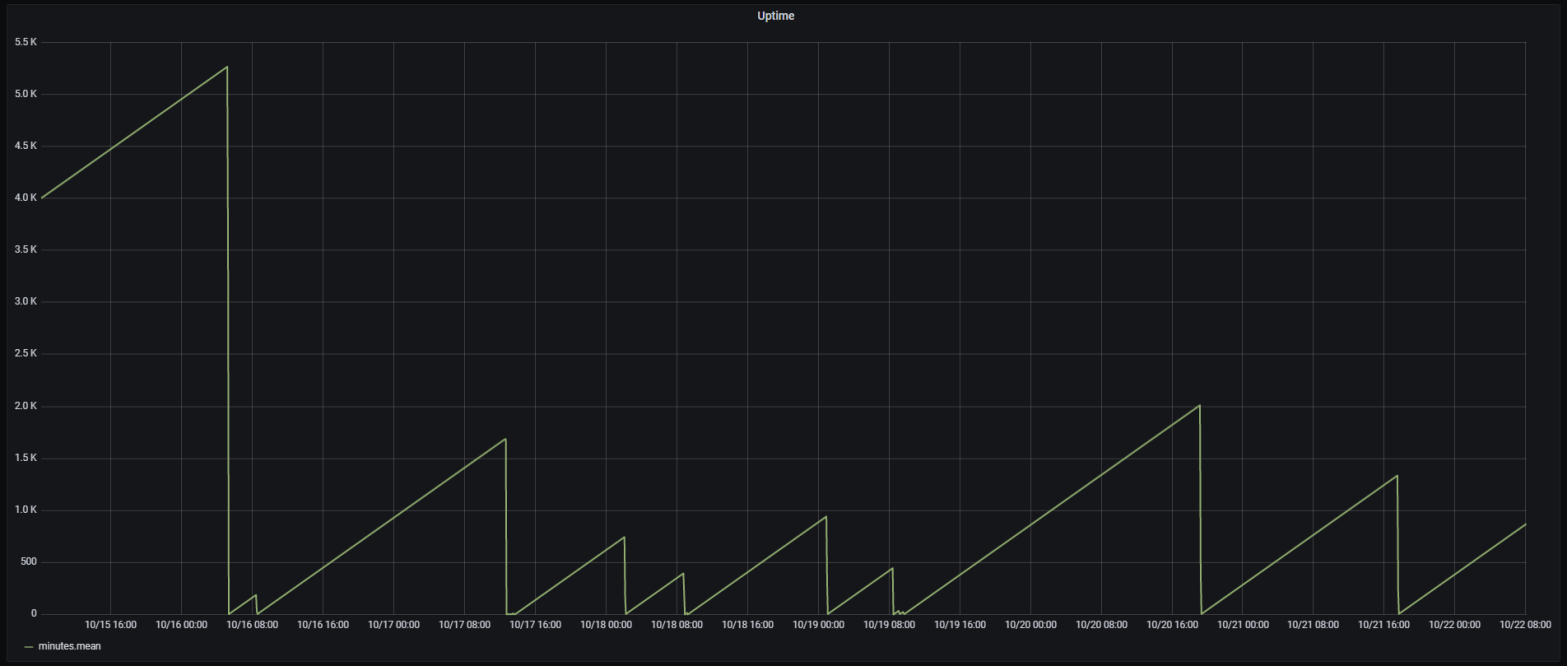
The ESP8266 would randomly restart, which I can observe by monitoring the uptime reported by ESPHome to Home Assistant.

It is difficult to debug because the Sonoff TH10 is in a waterproof case in my garage, making it difficult to get a USB/UART connection for debug logging. The alternative is to monitor logs over the network, and to include the debug component that will log the restart reason. But, network logging does not capture crash information, that is only logged by UART.
Using network logging I can observe that the restart reason is due to the hardware watchdog.
[00:16:36][D][debug:023]: ESPHome version 1.15.2
[00:16:36][D][debug:025]: Free Heap Size: 21984 bytes
[00:16:36][D][debug:053]: Flash Chip: Size=1024kB Speed=40MHz Mode=DOUT
[00:16:36][D][debug:190]: Chip ID: 0x00006BAB
[00:16:36][D][debug:191]: SDK Version: 2.2.2-dev(38a443e)
[00:16:36][D][debug:192]: Core Version: 2_7_4
[00:16:36][D][debug:193]: Boot Version=31 Mode=1
[00:16:36][D][debug:194]: CPU Frequency: 80
[00:16:36][D][debug:195]: Flash Chip ID=0x0014605E
[00:16:36][D][debug:196]: Reset Reason: Hardware Watchdog
[00:16:36][D][debug:197]: Reset Info: Fatal exception:4 flag:1 (Hardware Watchdog) epc1:0x40102ff5 epc2:0x00000000 epc3:0x00000000 excvaddr:0x00000000 depc:0x00000000
The Arduino IDE includes the ability to debug crashes, but in ESPHome stack tracing can only be done when actively logging over UART, i.e. no postmortem debugging capability in ESPHome.
So how do I get a local COM port mapped to a remote UART port? I know there are commercial remote COM and USB over network solutions, but I was wondering if I could use one ESP to monitor another ESP. I started looking for code examples, and this lead me to the open source JeeLabs Esp-Link, that was exactly what I needed.
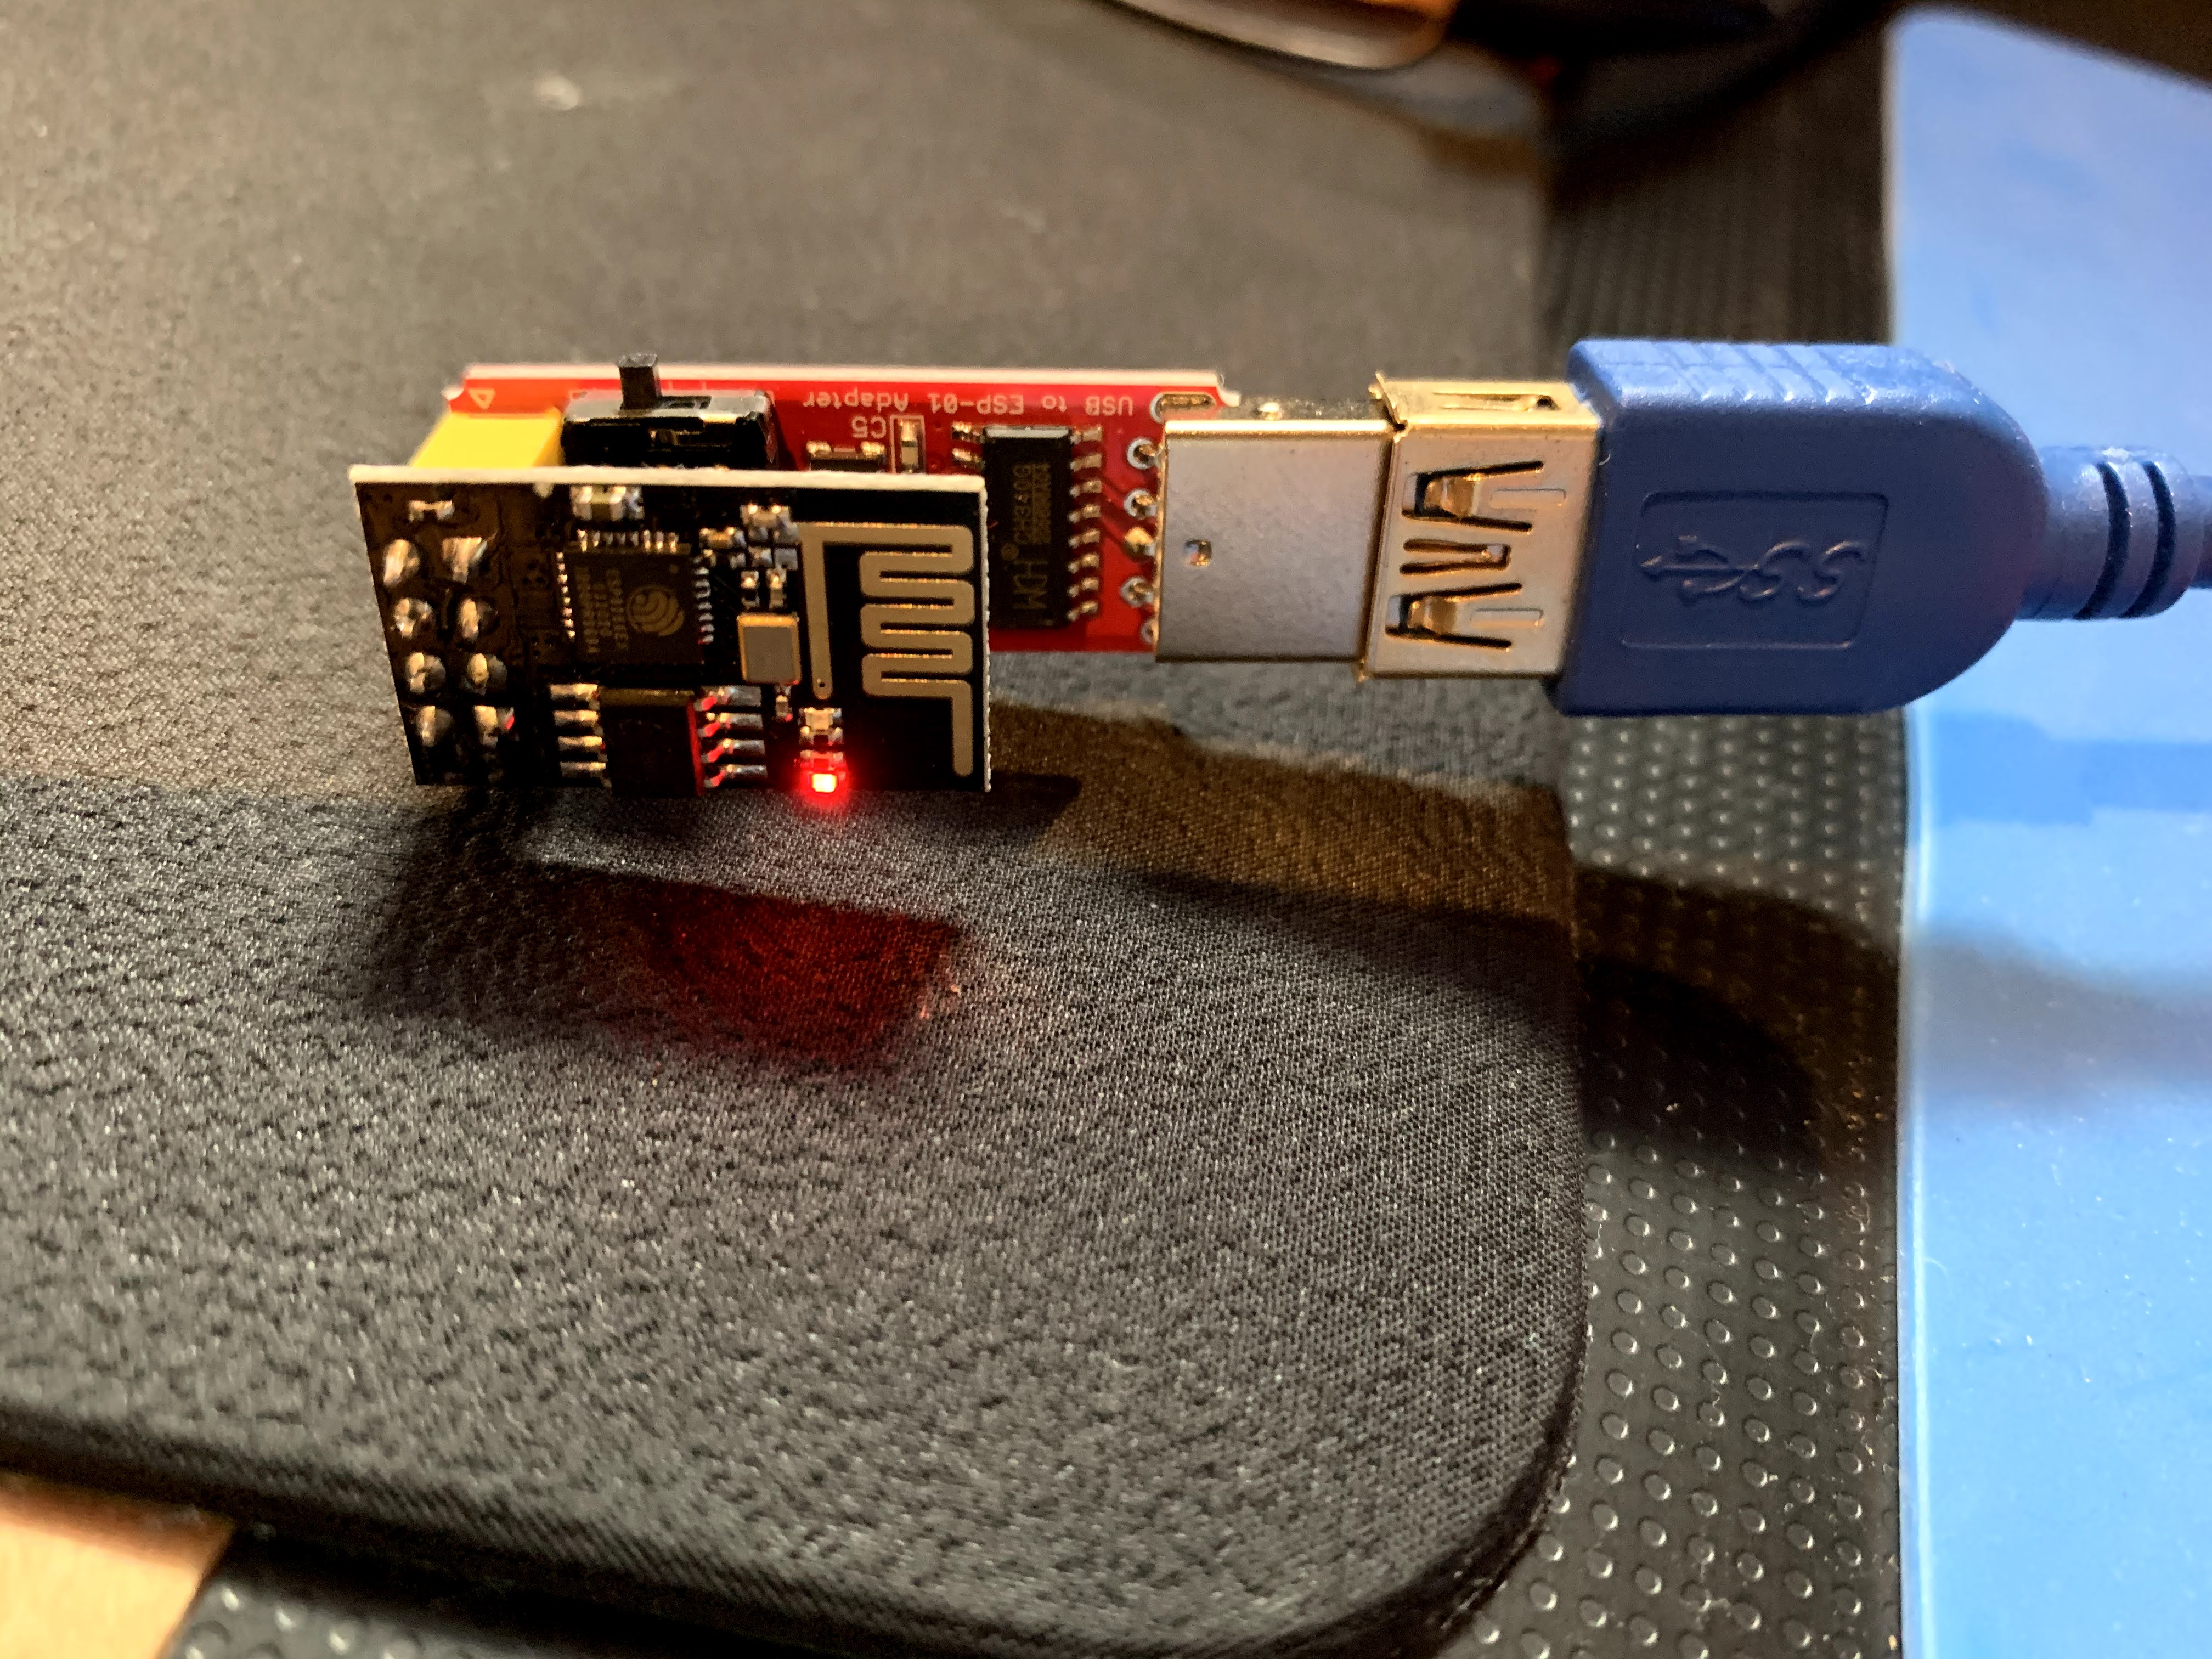
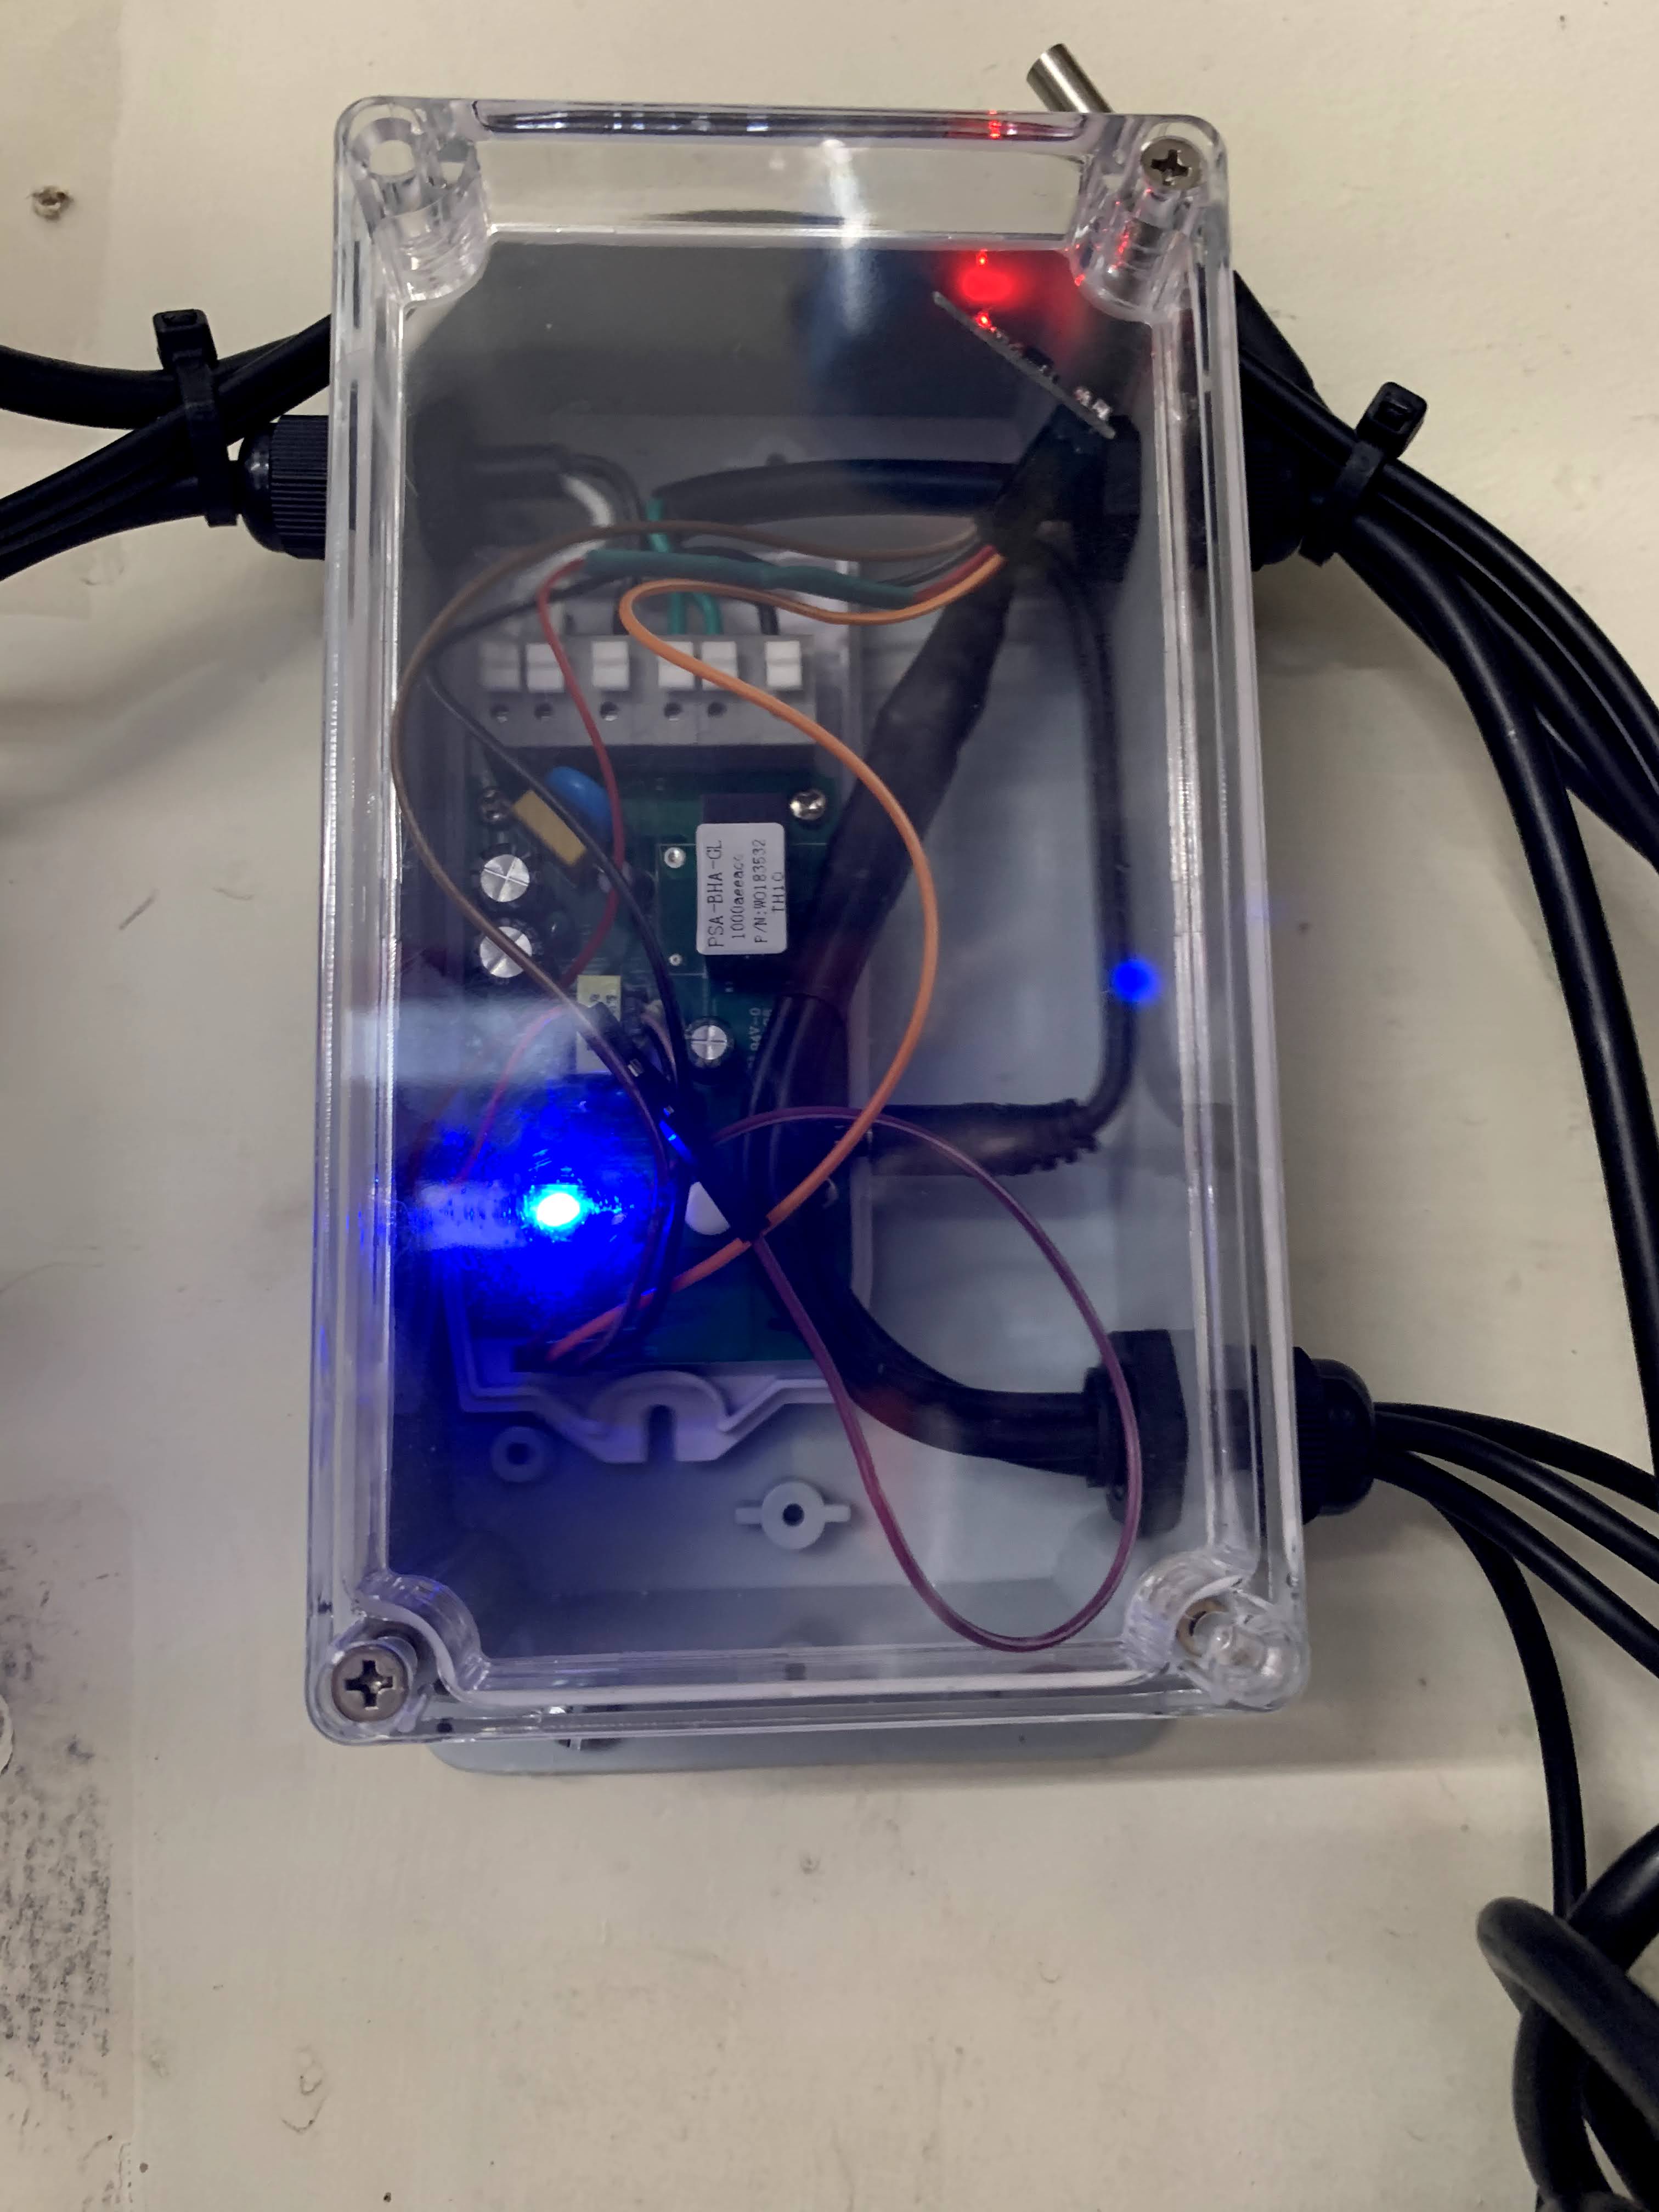
I bought a ESP-01S and programmer, the ESP-01S is small enough to fit inside the enclosure with the TH10, and can be powered by the TH10. The initial firmware flashing instructions were a bit sketchy, specifically what offsets to use for various hardware types. Once I figured the tool options out, I found programming from Ubuntu on Win10 running WSL2 was really easy, as the physical USB programmer port is transparently available in Ubuntu.
# sudo apt update
# sudo apt upgrade
# sudo apt install esptool

# wget http://s3.voneicken.com/esp-link/esp-link-v3.2.47-g9c6530d.tgz
# tar zxvf esp-link-v3.2.47-g9c6530d.tgz
# cd esp-link-v3.2.47-g9c6530d

# esptool --port /dev/ttyS5 flash_id
esptool.py v2.8
Serial port /dev/ttyS5
Connecting….
Detecting chip type… ESP8266
Chip is ESP8266EX
Features: WiFi
Crystal is 26MHz
MAC: 10:52:1c:f9:89:ec
Enabling default SPI flash mode…
Manufacturer: d8
Device: 4014
Detected flash size: 1MB
Hard resetting via RTS pin…

# esptool --port /dev/ttyS5 write_flash \
    0x00000 boot_v1.7.bin \
    0x01000 user1.bin \
    0xFC000 esp_init_data_default.bin \
    0xFE000 blank.bin
esptool.py v2.8
Serial port /dev/ttyS5
Connecting…
Detecting chip type… ESP8266
Chip is ESP8266EX
Features: WiFi
Crystal is 26MHz
MAC: 10:52:1c:f9:89:ec
Enabling default SPI flash mode…
Configuring flash size…
Auto-detected Flash size: 1MB
Erasing flash…
Flash params set to 0x0020
Took 0.06s to erase flash block
Wrote 4096 bytes at 0x00000000 in 0.4 seconds (80.7 kbit/s)…
Erasing flash…
Took 1.47s to erase flash block
Wrote 345088 bytes at 0x00001000 in 34.1 seconds (81.0 kbit/s)…
Erasing flash…
Took 0.05s to erase flash block
Wrote 1024 bytes at 0x000fc000 in 0.1 seconds (83.8 kbit/s)…
Erasing flash…
Took 0.04s to erase flash block
Wrote 4096 bytes at 0x000fe000 in 0.4 seconds (83.5 kbit/s)…
Leaving…
Hard resetting via RTS pin…
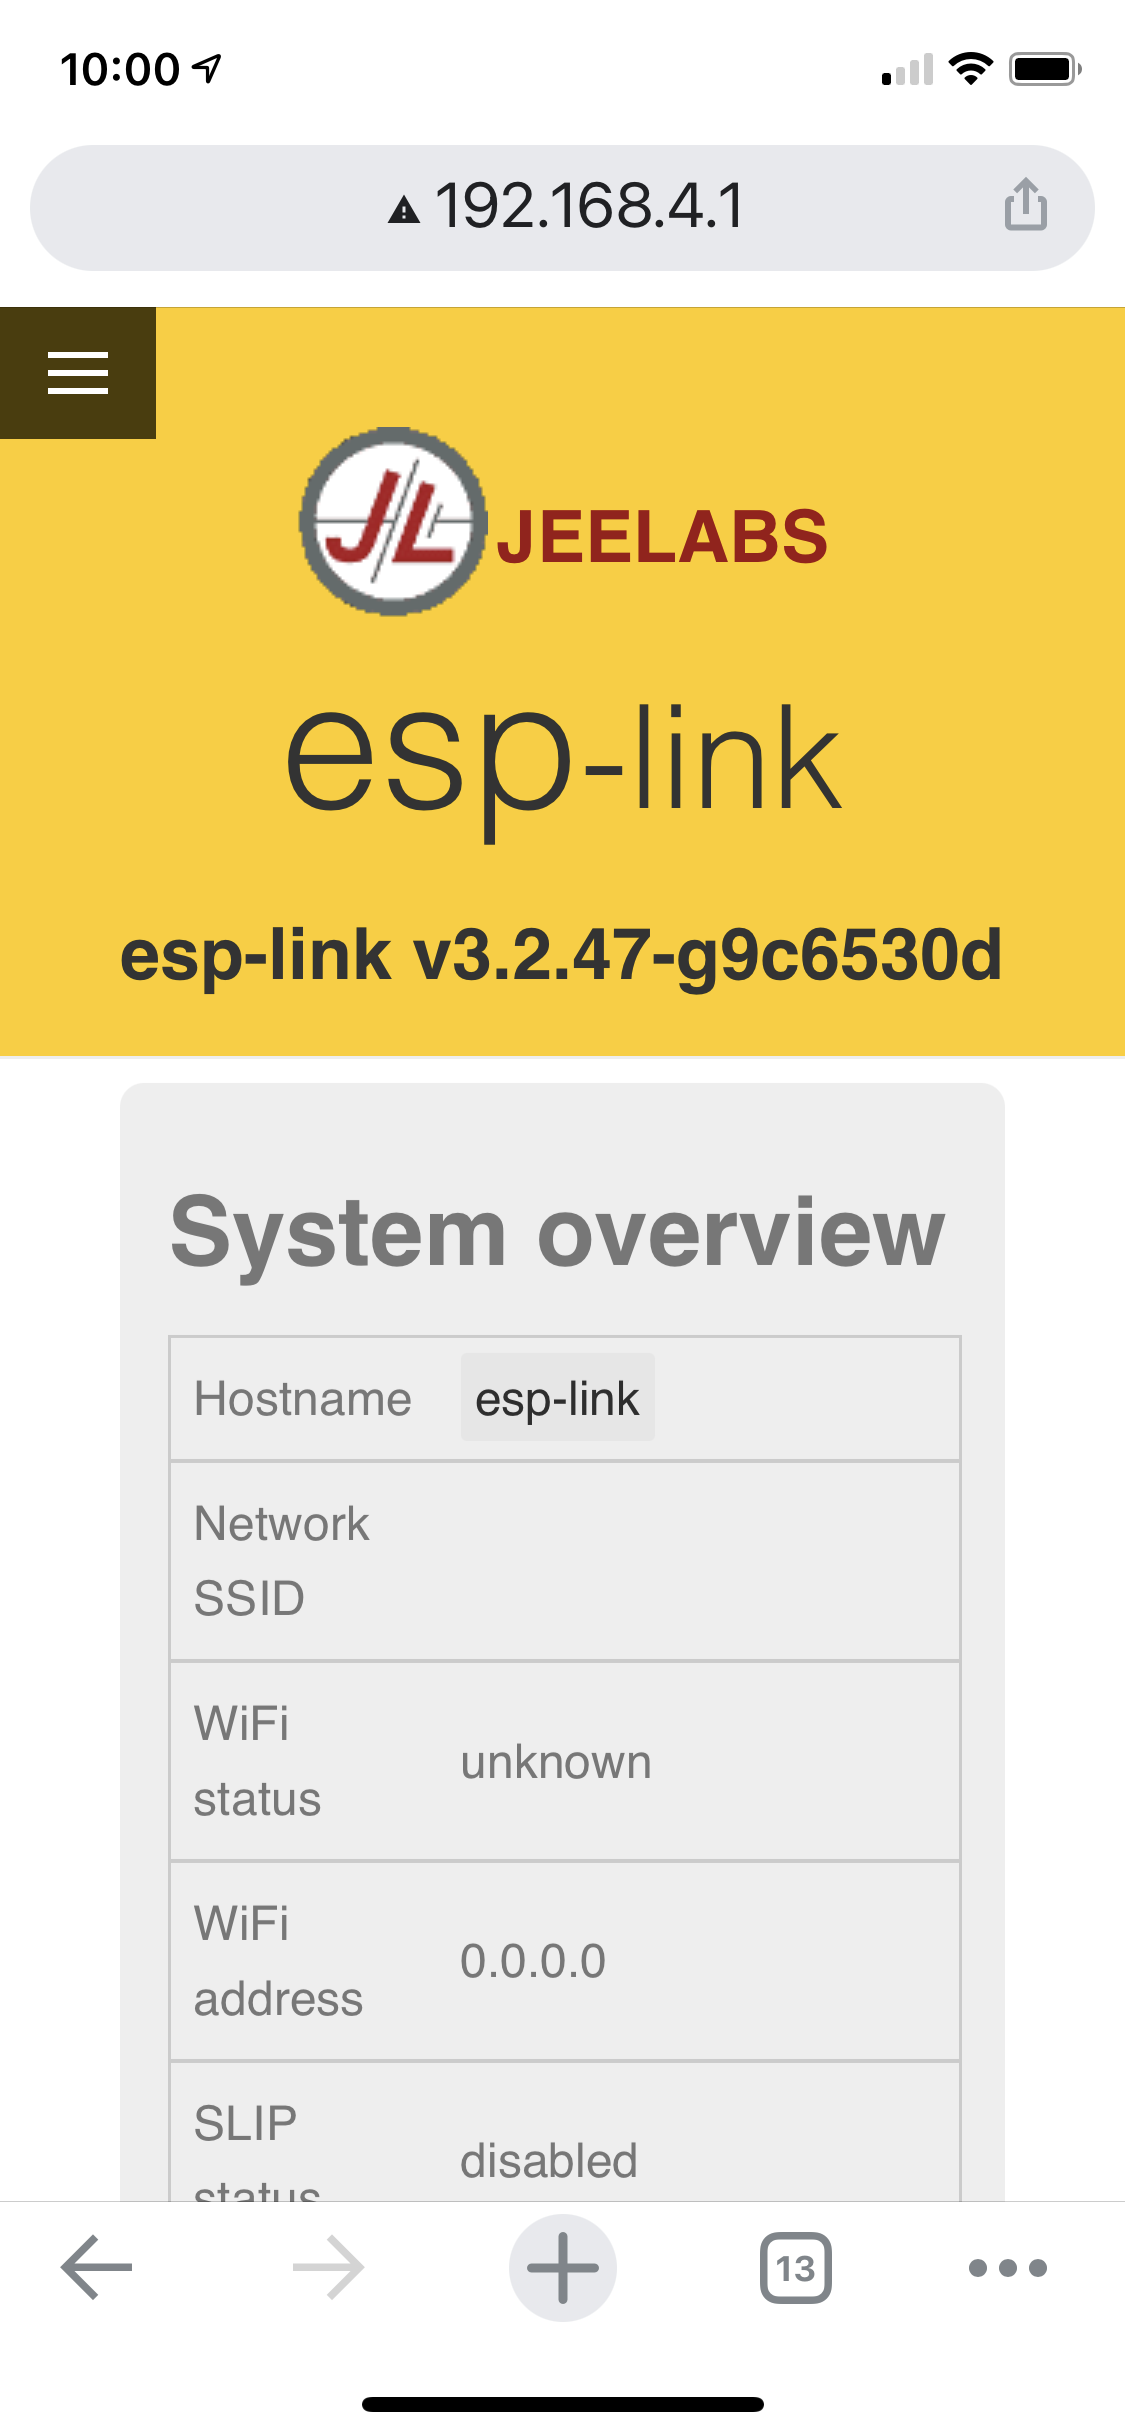
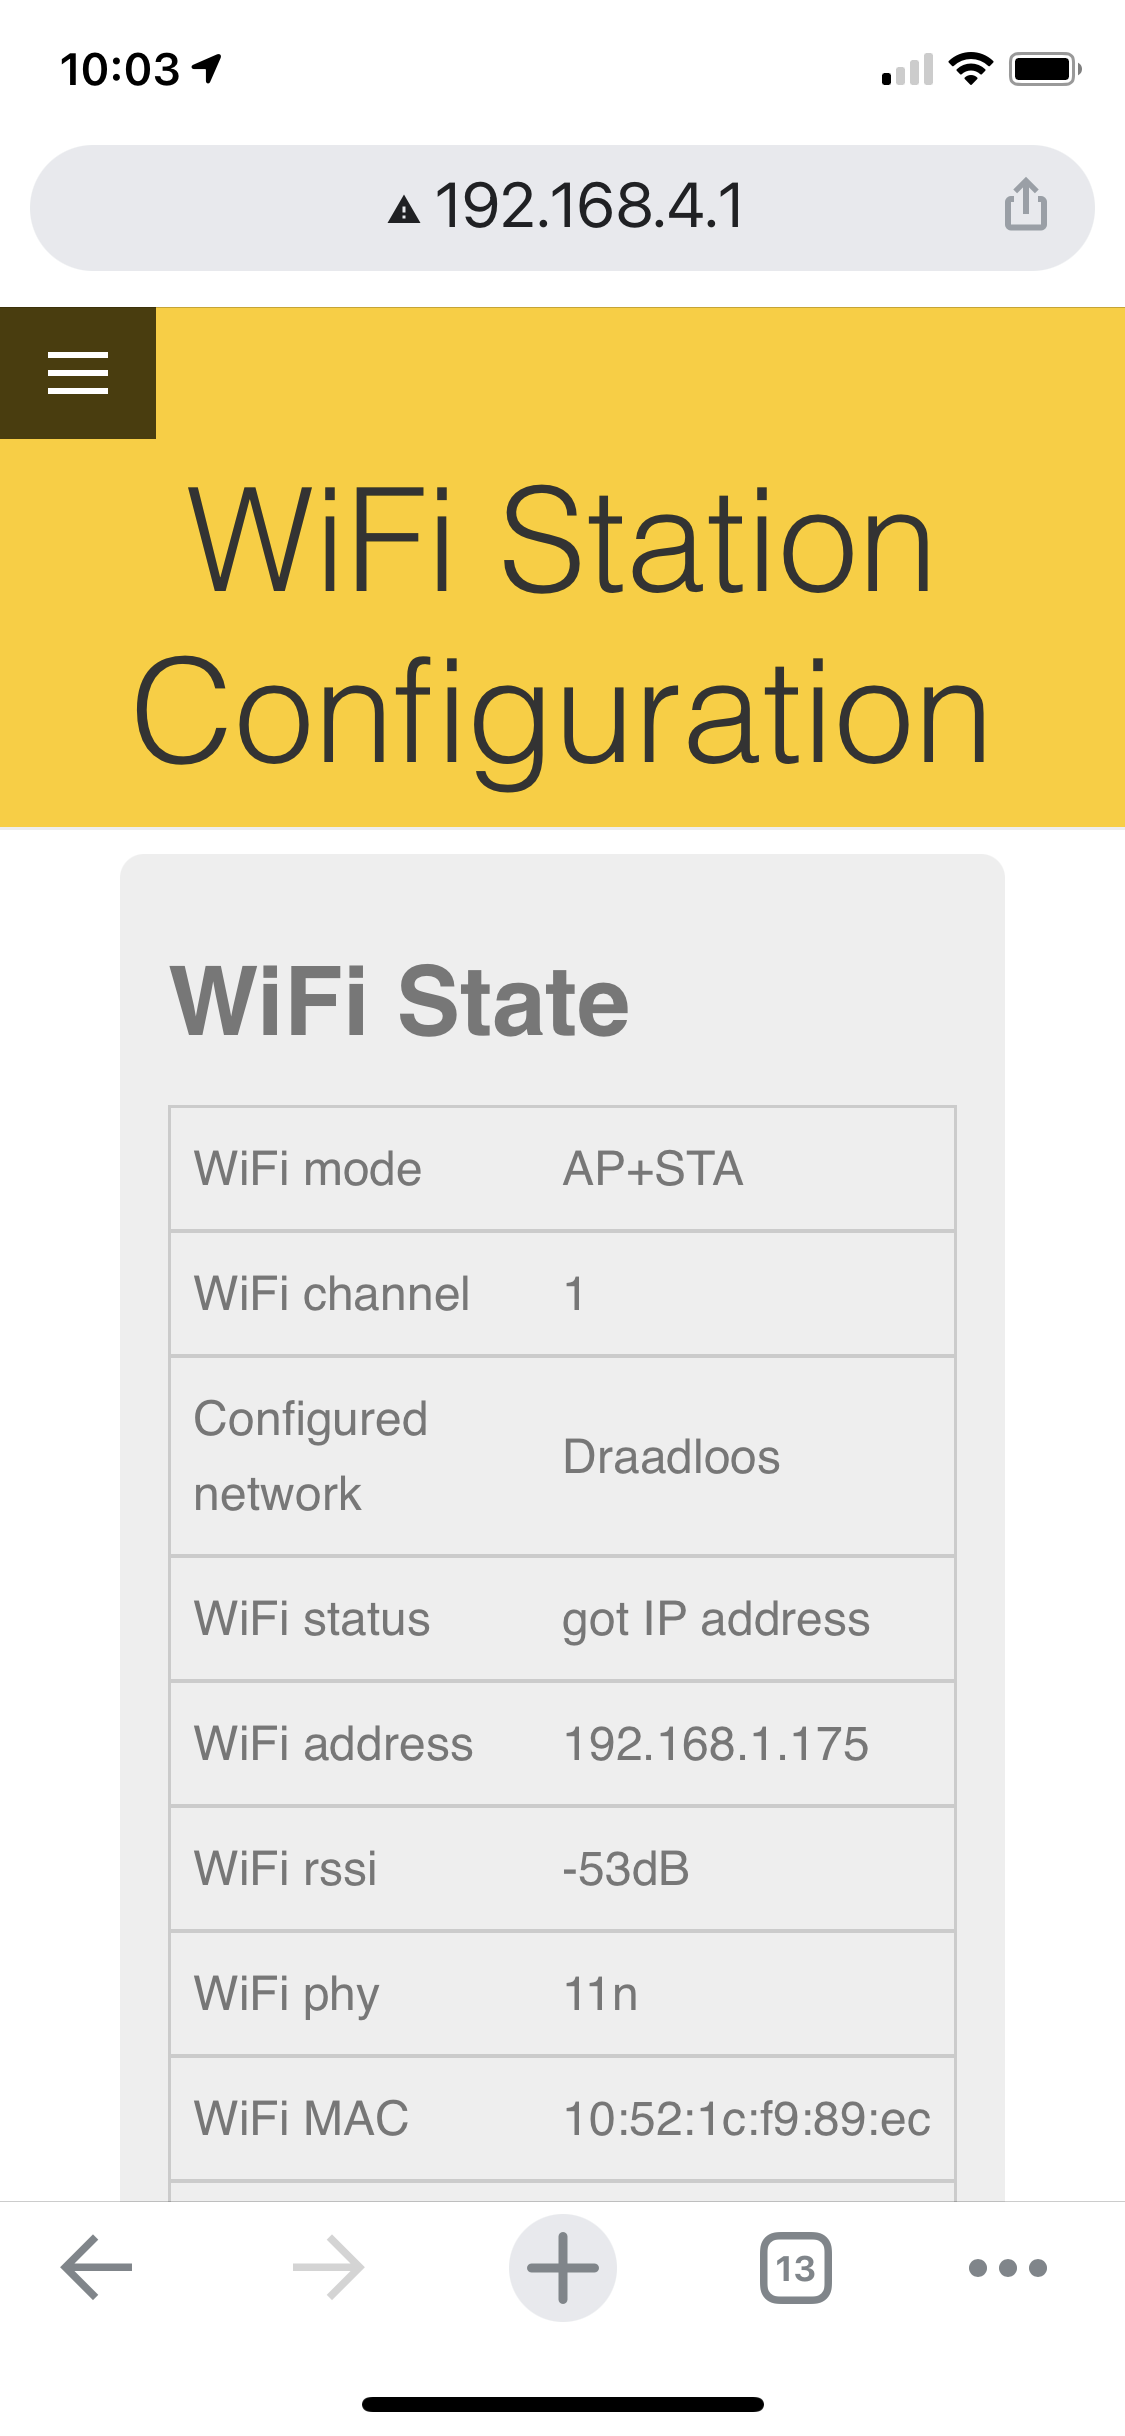
WiFi setup follows the typical steps of first connecting to the ESP in AP mode, then configuring WiFi and switching to client mode. I connected the ESP-01S to the TH10 using the pin header VCC-VCC, GND-GND, RX-TX, and TX-RX, powered on, and nothing. A bit of head scratching, re-reviewing the ESP-01S pin layout, and I forgot to pull CH_EN high, connecting CH_EN to VCC, powered on, and I got the TH10 UART monitored.

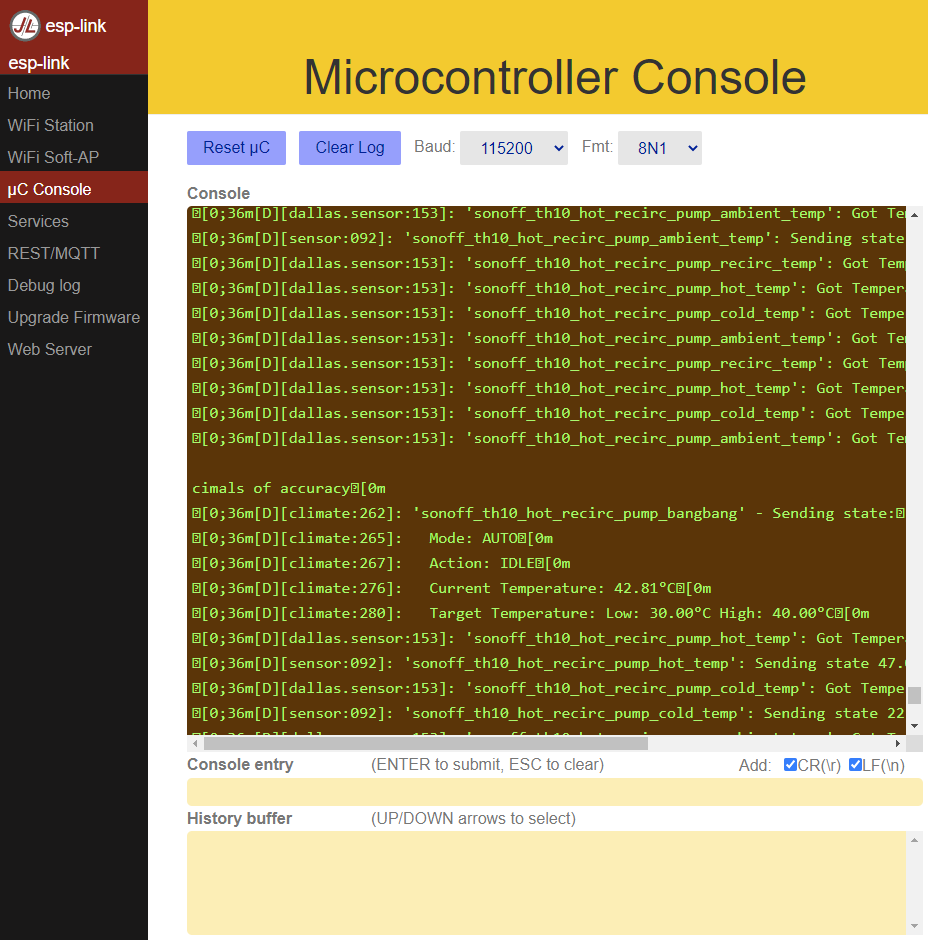
I found a helpful article that helped me connect Esp-Link to a COM port in Linux using socat. As I’m running ESPHome in a docker container, I attached to the container console to use the ESPHome CLI for logging.
# apt update
# apt upgrade
# apt install socat

# socat -d pty,link=/dev/ttyESP,raw tcp:esp-link:23 &
[1] 1794

# esphome sonoff_th10_hot_recirc_pump.yaml logs --serial-port /dev/ttyESP
INFO Reading configuration sonoff_th10_hot_recirc_pump.yaml…
INFO Detected timezone 'PST' with UTC offset -8 and daylight savings time from 14 March 02:00:00 to 07 November 02:00:00
INFO Starting log output from /dev/ttyESP with baud rate 115200
[17:10:54][D][dallas.sensor:153]: 'sonoff_th10_hot_recirc_pump_recirc_temp': Got Temperature=30.9°C
[17:10:54][D][sensor:092]: 'sonoff_th10_hot_recirc_pump_recirc_temp': Sending state 30.91667 °C with 1 decimals of accuracy
[17:10:54][D][climate:262]: 'sonoff_th10_hot_recirc_pump_bangbang' - Sending state:
[17:10:54][D][climate:265]: Mode: AUTO
[17:10:54][D][climate:267]: Action: IDLE
[17:10:54][D][climate:276]: Current Temperature: 30.92°C
[17:10:54][D][climate:280]: Target Temperature: Low: 30.00°C High: 40.00°C
[17:10:54][D][dallas.sensor:153]: 'sonoff_th10_hot_recirc_pump_hot_temp': Got Temperature=40.2°C
[17:10:54][D][sensor:092]: 'sonoff_th10_hot_recirc_pump_hot_temp': Sending state 40.29167 °C with 1 decimals of accuracy
[17:10:54][D][dallas.sensor:153]: 'sonoff_th10_hot_recirc_pump_cold_temp': Got Temperature=23.2°C
[17:10:54][D][sensor:092]: 'sonoff_th10_hot_recirc_pump_cold_temp': Sending state 23.18750 °C with 1 decimals of accuracy
[17:10:54][D][dallas.sensor:153]: 'sonoff_th10_hot_recirc_pump_ambient_temp': Got Temperature=26.6°C
[17:10:54][D][sensor:092]: 'sonoff_th10_hot_recirc_pump_ambient_temp': Sending state 26.62500 °C with 1 decimals of accuracy
Resets happen randomly, but I did manage to capture a few, unfortunately the UART output did not provide additional details other than wdt reset.
[20:42:51][D][sensor:092]: 'sonoff_th10_hot_recirc_pump_uptime': Sending state 6.83720 minutes with 0 decimals of accuracy
[20:43:04]
[20:43:04] ets Jan 8 2013,rst cause:4, boot mode:(3,5)
[20:43:04]
[20:43:04]wdt reset
[20:43:04]load 0x4010f000, len 3584, room 16
[20:43:04]tail 0
[20:43:04]chksum 0xb0
[20:43:04]csum 0xb0
[20:43:04]v2843a5ac
[20:43:04]~ld
[20:43:04][I][logger:166]: Log initialized

[20:43:14][D][debug:023]: ESPHome version 1.15.2
[20:43:14][D][debug:025]: Free Heap Size: 24568 bytes
[20:43:14][D][debug:053]: Flash Chip: Size=1024kB Speed=40MHz Mode=DOUT
[20:43:14][D][debug:190]: Chip ID: 0x00006BAB
[20:43:14][D][debug:191]: SDK Version: 2.2.2-dev(38a443e)
[20:43:14][D][debug:192]: Core Version: 2_7_4
[20:43:14][D][debug:193]: Boot Version=31 Mode=1
[20:43:14][D][debug:194]: CPU Frequency: 80
[20:43:14][D][debug:195]: Flash Chip ID=0x0014605E
[20:43:14][D][debug:196]: Reset Reason: Hardware Watchdog
[20:43:14][D][debug:197]: Reset Info: Fatal exception:4 flag:1 (Hardware Watchdog) epc1:0x40102ff5 epc2:0x00000000 epc3:0x00000000 excvaddr:0x00000000 depc:0x00000000
From what I gather a hardware watchdog reset will not provide a stack, so logging using ESPHome would really not add additional value. Further reading leads me to believe that the problem is either bad hardware (unlikely but not verified), or more likely bad code e.g. a missing ESP.wdtFeed() or yield(). It would have been helpful if ESPHome would also periodically report task load and memory state, maybe there is a correlation.
I logged an issue with ESPHome, asked for help in Discord, tried the Dev version of ESPHome, no luck. I’m no embedded programming expert, but debugging seems surprisingly difficult, maybe I’m not using the right tools?
The random restart is not detrimental to the operation of the controller, worst case the timer triggers more frequently than set, but it is annoying.

You must be logged in to post a comment.